New report on agriculture, GHG emissions, climate change, and the farm income crisis

Cover of Tackling the Farm Crisis and the Climate Crisis by Darrin Qualman

How can we reduce agricultural greenhouse gas (GHG) emissions by half by mid-century?  And how can steps to do so help strengthen and safeguard family farms?  These two questions are the focus of a new report written by Darrin Qualman in collaboration with the National Farmers Union (NFU).  The report is entitled Tackling the Farm Crisis and the Climate Crisis: A Transformative Strategy for Canadian Farms and Food Systems and it’s available from the NFU website.

The report looks at the climate crisis and the farm income crisis.  It concludes that our farms’ high emissions and low net incomes have the same cause: overdependence on purchased inputs: fertilizers, chemicals, fuels, etc.

The report shows clearly that the GHG emissions coming out of our farm and food systems are simply the downstream byproducts of the petro-industrial inputs we push in.  “Push in millions of gallons of fossil fuels and they will come out as millions of tonnes of carbon dioxide.  Push in megatonnes of fertilizers and they will come out as megatonnes of nitrous oxide.  As we have doubled and redoubled input use, we have doubled and redoubled the GHG emissions from agriculture,” states the report.  From this novel observation comes an inescapable conclusion: “Any low-emission food system will be a low-input food system.”

The report takes a long-term view and states that “10,000 years of human history makes one thing crystal clear: farming does not create GHG emissions; petro-industrial farm inputs create GHG emissions.”  It goes on to state that “Two things happen when farmers become overdependent on  purchased inputs: emissions go up, and net incomes go down.”

The report is optimistic, however, arguing that solutions to climate problems can also be solutions to farm income problems.  On average, farmers are now retaining just five cents out of every dollar they earn.  The other 95 cents go to pay for inputs—to pay fertilizer, chemical, seed, fuel, and machinery companies and other input and service providers.  But as input use is reduced as a way to reduce emissions, margins and net incomes can go up.  Steps to deal with the climate crisis can also be steps to solve the farm income crisis.

The report explores dozens of practical on-farm measures and government policies that can, taken together, reduce agricultural emissions by half by mid-century.  The report, however, does not underestimate the scale of the task ahead.  It acknowledges that “farmers, other citizens, all sectors, and all levels of government must mobilize, with near-wartime-levels of commitment and effectiveness, to slash emissions.  ”

The report is a hopeful blueprint for the transformation of our farms and food systems.  “We are looking at a future wherein agriculture must increasingly re-merge with nature and culture to create a much more integrated, life-sustaining, and community-sustaining agroecological model of human food provision, nutrition, and health.”

Darrin Qualman worked as Director of Research for the National Farmers Union from 1996 to 2010.  He is the author of the book, published in 2019, Civilization Critical: Energy, Food, Nature, and the Future.

Click HERE to read the report.

The nitrogen crisis: the other mega-threat to the biosphere

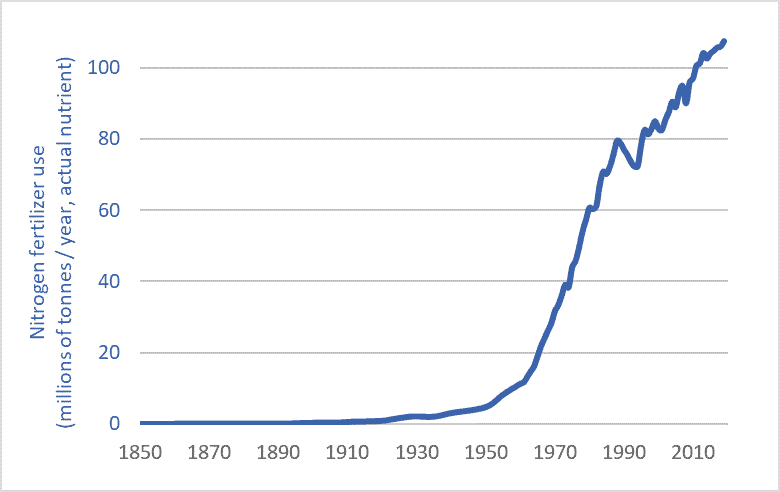
Nitrogen fertilizer use graph historic long-term 1850-2019
Global nitrogen fertilizer use, 1850-2019

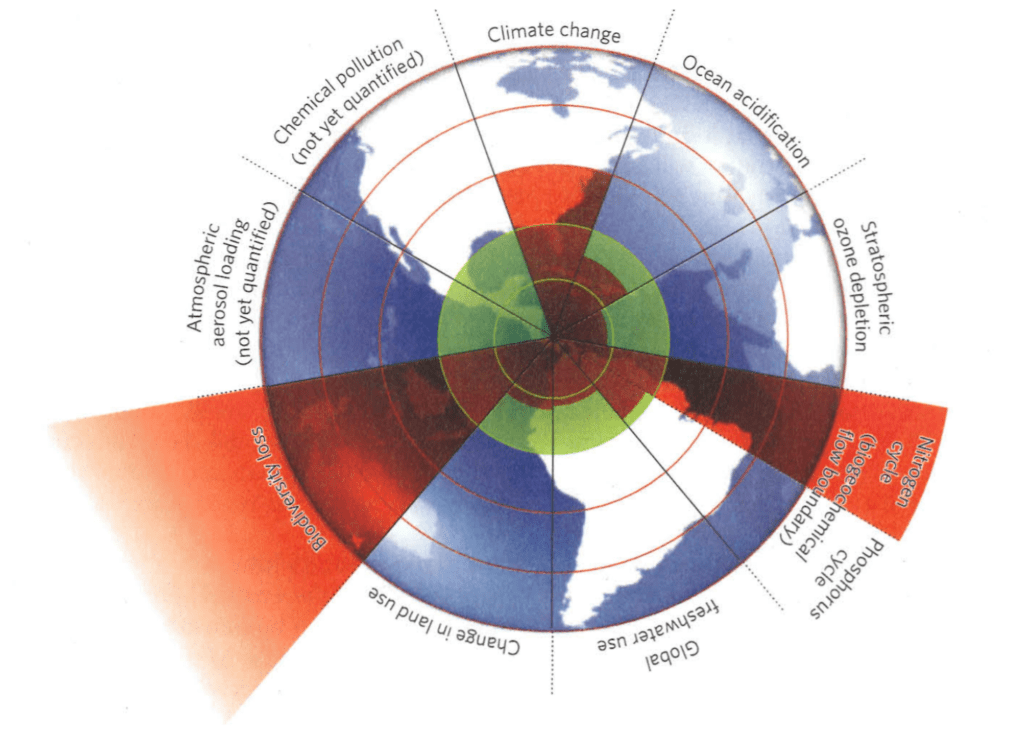
If there was no climate crisis we’d all be talking about the nitrogen crisis.  Humans have super-saturated Earth’s biosphere with reactive nitrogen, setting off a cascade of impacts from species shifts, ecosystem changes, and extinctions to ocean dead zones and algae-clogged lakes.  When scientists surveyed the many threats to the biosphere to determine a “safe operating space” for planet Earth, the areas in which they concluded that we’d pushed furthest past “planetary boundaries” were climate change, species extinction, and nitrogen flows.  The graphic below, from the journal Nature, shows the extent to which we’ve transgressed safe planetary boundaries.  Note nitrogen—the red wedge, lower right.

Planetary Boundaries Rockstrom Steffen et al

Source: Reproduced from: Johan Rockström, Will Steffen, et al., “A Safe Operating Space for Humanity,” Nature 461, no. 24 (2009).

A nitrogen primer

Nitrogen is indispensable for life—a building block of proteins and DNA.  Nitrogen (N) is one of the most important plant nutrients and the most heavily applied agricultural fertilizer.  Nitrogen  is common in the atmosphere—making up 78 percent of the air we breath.  But this atmospheric N is inert; non-reactive—it can’t be used by plants.  In contrast, reactive, plant-usable N is just one-one-thousandth as abundant in the biosphere as nitrogen gas is in the atmosphere.  For hundreds-of-millions of years, plants have struggled to find sufficient quantities of usable N.

But humans have intervened massively in the planet’s nitrogen cycles—effectively tripling the quantity of N flowing through terrestrial ecosystems—through farmland, forests, wetlands, and grasslands.  In intensively cropped areas, nitrogen flows are now ten times higher than natural levels.

Here’s the most important part: nitrogen is a fossil-fuel product.  Natural gas is the main input for making N fertilizer.  That gas provides the tremendous energy, heat, and pressure needed to split atmospheric nitrogen molecules and combine N atoms with hydrogen to make reactive compounds.  The amount of energy needed to create, transport, and apply one tonne of N fertilizer is nearly equal to two tonnes of gasoline.  Nitrogen is one way that we push fossil-fuel energy into the food system in order to push more food out.  We turn fossil fuels into fertilizer into food into us.

Humans managed to increase global food production about eight-fold during the 20th and early 21st centuries.*  There’s more tonnage coming out of our food system.  But that system is linear, so if there’s more food coming out one end, there must be more inputs being pushed into the other end—more energy, chemicals, and fertilizers.  The graph above shows how humans have increased N fertilizer inputs three-hundred-fold since 1900 and thereby helped increase human food outputs eight-fold, and human populations four-and-a-half-fold.  By pushing in a hundred million tonnes of fossil-fuel-derived fertilizer we can push out enough food to feed an additional six billion people.  (for more information on nitrogen, see chapters 3 and 28 of my recent book, Civilization Critical.)

Greenhouse gas emission from nitrogen fertilizer

The nitrogen crisis is compounded by the fact that N production and use drive climate change.  The production and use of nitrogen fertilizer is unique among human activities in that it produces large quantities of all three of the main greenhouse gases: carbon dioxide (from fertilizer-production facilities fueled by natural gas); nitrous oxide (from soils over-enriched by factory-made N); and methane (from the production and distribution of natural gas feedstocks and from the fertilizer-production process, i.e., from fracking, leaking gas pipelines, and from emissions from fertilizer plants).  A 2019 science journal article reported that actual methane emissions from fertilizer plants may be 100 times higher than previously assumed.  Emissions from N fertilizer production and use make up about half the total emissions from agriculture in many regions.  It’s fertilizer, not diesel fuel, that’s the largest emissions source on many farms.

Alternatives

We cannot continue to push massive quantities of petro-industrial N fertilizer into our farm fields and ecosystems.   Luckily there are alternatives and partial solutions.  these include:
– Getting nitrogen from natural sources: legumes and better crop rotations;
– Scaling back our demand for agricultural products: reducing food waste; rethinking biofuels; minimizing nutritionally disfigured food (sugar pops and tater tots); ceasing the attempt to globally proliferate North American levels of meat consumption;
– Funding agronomic research into low-input, organic, and agro-ecological production systems;  and
– Rationalizing and democratizing our food system—moving away from systems based on yield-, output-, trade-, and profit-maximization; corporate control; farmer elimination; and energy- and emission-maximization to new paradigms based on food sovereignty, health and nutrition-maximization, input-optimization, emissions-reduction, and long-term sustainability.

Any maximum-input, maximum-output agricultural system will  be a high-emission system.  Input reduction, however, can boost sustainability and net farm incomes while reducing energy use and emissions.  Cutting N use is key.

* The FAO records a four-fold increase in grain production between 1950 and 2018 and it is likely that production roughly doubled between 1900 and 1950, so an eight- to ten-fold increase in production is likely between 1900 and 2018.

Graph sources:
International Fertilizer Association (IFA);
– Vaclav Smil, Enriching the Earth (Cambridge, MA: The MIT Press, 2001);
– UN Food and Agriculture Organization (FAO), FAOSTAT; and
– Clark Gellings & Kelly Parmenter, “Energy Efficiency in Fertilizer Production and Use.”


Through the mill: 150 years of wheat price data

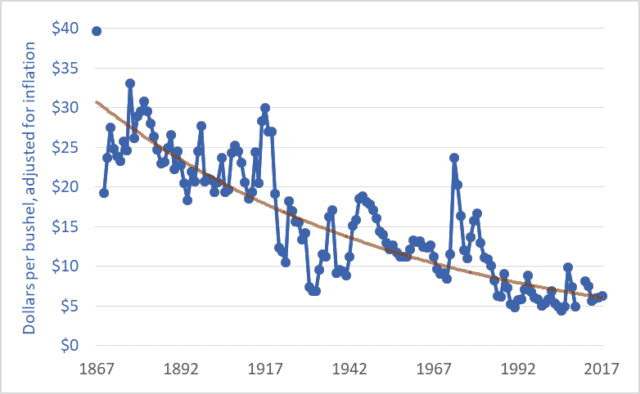
Graph of wheat price, western Canada (Sask. or Man.), farmgate, dollars per bushel, 1867–2017
Wheat price, western Canada (Sask. or Man.), farmgate, dollars per bushel, 1867–2017

The price of wheat is declining, and it has been for many years.  The same is true for the prices of other grains and oilseeds.  The graph above shows wheat prices in Canada since Confederation—over the past 150 years.  The units are dollars per bushel.  A bushel is 60 pounds (27 kilograms).  The brown line suggests a trendline.

These prices are adjusted for inflation.  The downward trend reflects the fact that wheat prices fell relative to prices for nearly all other goods and services; as time went on it took more and more bushels of wheat or other grains to buy a pair of shoes, lunch, or a movie ticket.  For example, my father bought a new, top-of-the-line pickup truck in 1976 for $6,000, equivalent to about 1,200 bushels of wheat at the time.  Today, a comparable pickup (base model) might cost the equivalent of about 4,000 bushels of wheat.  As a second example, a house in 1980 might have cost the equivalent of 20,000 bushels of wheat; today, that very same house would cost the equivalent of 60,000 bushels.

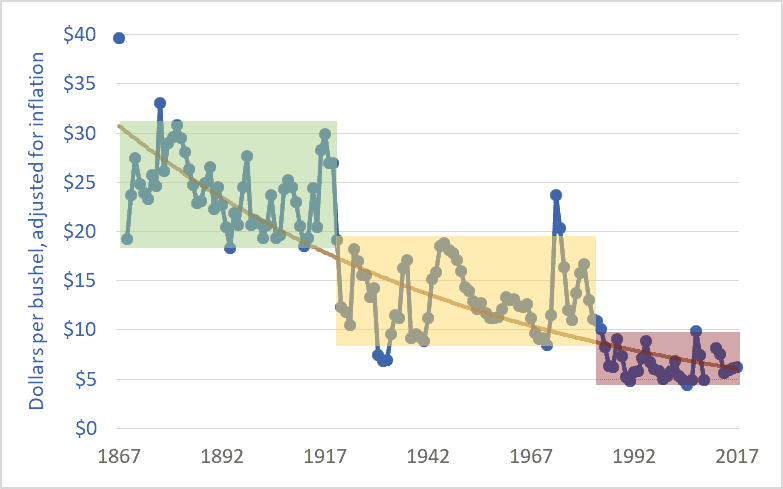
The graph below adds shaded boxes to highlight three distinct periods in Canadian wheat prices.  The period from Confederation to the end of the First World War saw prices roughly in the range of $20 to $30 per bushel (adjusted to today’s dollars).  From 1920 to the mid-’80s, prices entered a new phase, and oscillated between about $8 and $18 per bushel.  And in 1985, wheat prices entered a third phase, oscillating between $5 and $10 per bushel, more often closer to $5 than $10.  In each phase, the top of the range in a given period is roughly equal to the bottom of the range in the previous period.

Graph of wheat price, western Canada (Sask. or Man.), farmgate, dollars per bushel, 1867–2017
Wheat price, western Canada, farmgate, dollars per bushel

1985 is often cited as the beginning of the farm crisis period.  The graph above shows why the crisis began in that year.  Grain prices since the mid-’80s have been especially damaging to Canadian agriculture.  The post-1985 collapse in grain prices has had several effects:

– The expulsion of one-third of Canadian farm families in just one generation;
– The expulsion of two-thirds of young farmers (under 35 years of age) over the same period;
– A tripling of farm debt, to a record $102 billion;
– A chronic need to transfer taxpayer dollars to farmers through farm-support programs (with transfers totaling $110 billion since 1985); and
– A push toward farm giantism, with the majority of land in western Canada now operated by farms larger than 3,000 acres, and with many farms covering tens-of-thousands of acres.

As per-bushel and per-acre margins fall, the solution is to cover more acres.  The inescapable result is fewer farms and farmers.

It is impossible to delve into all the causes of the grain price decline in one blog post.  Briefly, farmers are getting less and less because others are taking more and more.  A previous blog post highlighted the widening gap between what Canadians pay for bread in the grocery store and what farmers receive for wheat at the elevator.  This widening gap is created because grain companies, railways, milling companies, other processors, and retailers are taking more and more, chocking off the flow of dollars to farmers.  This is manifest in declining prices.  Agribusiness giants are profiting by charging consumers more per loaf and paying farmers less per bushel.

Of course, grain prices are a function of domestic and international markets.  The current free trade and globalization era began in the mid-1980s.  (The Canada-US Free Trade Agreement was concluded in 1987, the North American Free Trade Agreement in 1994, and the World Trade Organization Agreement on Agriculture in 1995.)  The effect of free trade and globalization has been to plunge all the world’s farmers into a single, borderless, hyper-competitive market.  At the same time, agribusiness corporations entered a period of accelerating mergers in order to reduce the competition they faced.  As competition levels increase for farmers and decrease for agribusiness corporations it is easy to predict shifts in relative profitability.  Increased competition for farmers meant lower prices while decreased competition for agribusiness transnationals translated into higher prices and profits.

Graph sources:
– 1867–1974: Historical Statistics of Canada, eds. Leacy, Urquhart, and Buckley, 2nd ed. (Ottawa: Statistics Canada, 1983);
– 1890–1909: Wholesale Prices in Canada, 189O–19O9, ed. R. H. Coats (Ottawa: Government Printing Bureau, 1910);
– 1908–1984: Statistics Canada, Table: 32-10-0359-01 Estimated areas, yield, production, average farm price and total farm value of principal field crops (formerly CANSIM 001-0017);
– 1969–2009: Saskatchewan Agriculture and Food: Statfact, Canadian Wheat Board Final Price for Wheat, basis in store Saskatoon;
– 2012–2018: Statistics Canada, Table: 32-10-0077-01 Farm product prices, crops and livestock (formerly CANSIM 002-0043).

Methane and climate: 10 things you should know

Graph of global atmospheric methane concentrations
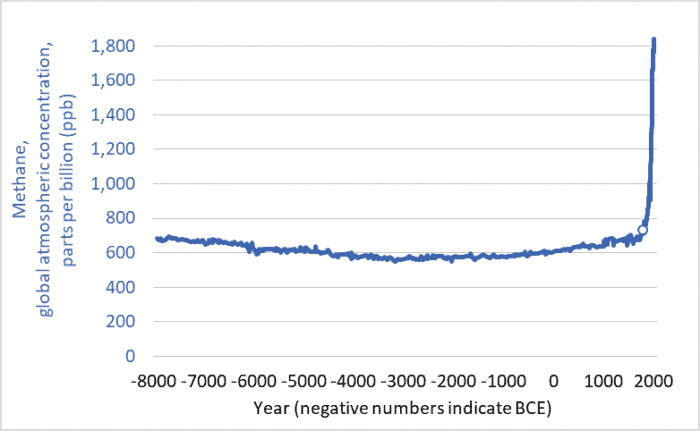
Global atmospheric methane concentrations, past 10,000+ years (8000 BCE to 2018 CE)

The graph above shows methane concentrations in Earth’s atmosphere over the past 10,000+ years: 8000 BCE to 2018 CE.  The units are parts per billion (ppb).  The year 1800 is marked with a circle.

Note the ominous spike.  As a result of increasing human-caused emissions, atmospheric methane levels today are two-and-a-half times higher than in 1800.  After thousands of years of relatively stable concentrations, we have driven the trendline to near-vertical.

Here are 10 things you should know about methane and the climate:

1. Methane (CH4) is one of the three main greenhouse gases, along with carbon dioxide (CO2) and nitrous oxide (N2O).

2. Methane is responsible for roughly 20% of warming, while carbon dioxide is responsible for roughly 70%, and nitrous oxide the remaining 10%.

3. Methane is a powerful greenhouse gas (GHG).  Pound for pound, it is 28 times more effective at trapping heat than is carbon dioxide (when compared over a 100-year time horizon, and 84 times as effective at trapping heat when compared over 20 years).  Though humans emit more carbon dioxide than methane, each tonne of the latter traps more heat.

4. Fossil-fuel production is the largest single source.  Natural gas is largely made up of methane (about 90%).  When energy companies drill wells, “frac” wells, and pump natural gas through vast distribution networks some of that methane escapes.  (In the US alone, there are 500,000 natural gas wells, more than 3 million kilometers of pipes, and millions of valves, fittings, and compressors; see reports here and here.)  Oil and coal production also release methane—often vented into the atmosphere from coal mines and oil wells.  Fossil-fuel production is responsible for about 19% of total (human-caused and natural) methane emissions.  (An excellent article by Saunois et al. is the source for this percentage and many other facts in this blog post.)  In Canada, policies to reduce energy-sector methane emissions by 40 percent will be phased in over the next seven years, but implementation of those policies has been repeatedly delayed.

5. Too much leakage makes electricity produced using natural gas as climate-damaging as electricity from coal.  One report found that for natural gas to have lower overall emissions than coal the leakage rate would have to be below 3.2%.  A recent study estimates leakage in the US at 2.3%.  Rates in Russia, which supplies much of the gas for the EU, are even higher.  Until we reduce leakage rates, the advantage of shutting down coal-fired power plants and replacing them with natural gas generation will remain much more modest than often claimed.

6. Domestic livestock are the next largest source of methane.  Cattle, sheep,  and other livestock that graze on grass emit methane from their stomachs through their mouths.  This methane is produced by the symbiotic bacteria that live in the guts of these “ruminants” and enable them to digest grass and hay.  In addition, manure stored in liquid form also emits methane.  Livestock and manure are responsible for roughly 18% of total methane emissions.

7. Rice paddy agriculture, decomposing organic matter in landfills, and biomass burning also contribute to methane emissions.  Overall, human-caused emissions make up about 60% of the total.  And natural sources (wetlands, swamps, wild ruminants, etc.) contribute the remaining 40%.

8. There is lots of uncertainty about emissions.  Fossil fuel production and livestock may be responsible for larger quantities than is generally acknowledged.  The rise in atmospheric concentrations is precisely documented, but the relative balance between sources and sinks and the relative contribution of each source is not precisely known.

9. There is a lot of potential methane out there, and we risk releasing it.  Most of the increase in emissions in recent centuries has come from human systems (fossil fuel, livestock, and rice production; and landfills).  Emissions from natural systems (swamps and wetlands, etc.) have not increased by nearly as much.  But that can change.  If human actions continue to cause the planet to warm, natural methane emissions will rise as permafrost thaws.  (Permafrost contains huge quantities of organic material, and when that material thaws and decomposes in wet conditions micro-organisms can turn it into methane.)  Any such release of methane will cause more warming which can thaw more permafrost and release more methane which will cause more warming—a positive feedback.

Moreover, oceans, or more specifically their continental shelves, contain vast quantities of methane in the form of “methane hydrates” or “clathrates”—ice structures that hold methane stable so long as the temperature remains cold enough.  But heat up the coastal oceans and some of that methane could begin to bubble up to the surface.  And there are huge amounts of methane contained in those hydrates—the equivalent of more than 1,000 years of human-caused emissions.  We risk setting off the “methane bomb“—a runaway warming scenario that could raise global temperatures many degrees and catastrophically damage the biosphere and human civilization.

Admittedly, the methane bomb scenario is unlikely to come to pass.  While some scientists are extremely concerned, a larger number downplay or dismiss it.  Nonetheless a runaway positive feedback involving methane represents a low-probability but massive-impact risk; our day-to-day actions are creating a small risk of destroying all of civilization and most life on Earth.

10. We can easily reduce atmospheric methane concentrations and  attendant warming; this is the good news.  Methane is not like CO2, which stays in the atmosphere for centuries.  No, methane is a “short-lived” gas.  On average, it stays in the atmosphere for less than ten years.  Many natural processes work to strip it out of the air.  Currently, human and natural sources emit about 558 million tonnes of methane per year, and natural processes in the atmosphere and soils remove all but 10 million tonnes.  (again, see Saunois et al.)  Despite our huge increase in methane production, sources and sinks are not that far out of balance.  Therefore, if we stop increasing our emissions then atmospheric concentrations could begin to fall.  We might see significant declines in just decades.  This isn’t the case for CO2, which will stay in the atmosphere for centuries.  But with methane, we have a real chance of reducing atmospheric levels and, as we do so, moderating warming and slowing climate change.

A series of policies focused on minimizing emissions from the fossil-fuel sector (banning venting and minimizing leaks from drilling and fracking and from pipes) could bring the rate of methane creation below the rate of removal and cause atmospheric levels to fall.  A more rational approach to meat production (including curbing over-consumption in North America and elsewhere) could further reduce emissions.  This is very promising news.  Methane reduction represents a “low-hanging fruit” when it comes to moderating climate change.

The methane problem is the climate problem in microcosm.  There are some relatively simple, affordable steps we can take now that will make a positive difference.  But, if we don’t act fast, aggressively, and effectively, we risk unleashing a whole range of effects that will swiftly move our climate into chaos and deprive humans of the possibility of limiting warming to manageable levels.  We can act to create some good news today, or we can suffer a world of bad news tomorrow.

Graph sources:
– United States Environmental Protection Agency (US EPA), “Climate Change Indicators: Atmospheric Concentrations of Greenhouse Gases.
– Commonwealth Scientific and Industrial Research Organisation (CSIRO), “Latest Cape Grim Greenhouse Gas Data.
– National Oceanic and Atmospheric Administration (NOAA), Earth System Research Laboratory, Global Monitoring Division, “Trends in Atmospheric Methane.

$100 billion and rising: Canadian farm debt

Graph of Canadian farm debt, 1971-2017
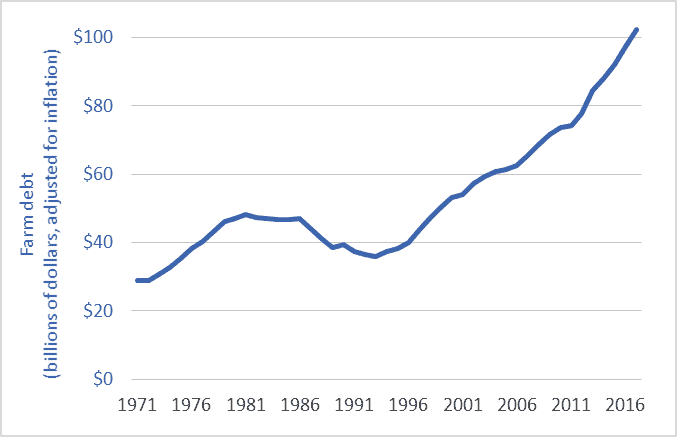
Canadian farm debt, 1971-2017

Canadian farm debt has risen past the $100 billion mark.  According to recently released Statistics Canada data, farm debt in 2017 was $102.3 billion—nearly double the level in 2000.  (All figures and comparisons adjusted for inflation.)

Some analysts and government officials characterize the period since 2007 as “better times” for farmers.  But during that period (2007-2017, inclusive) total farm debt increased by $37 billion—rising by more than $3 billion per year.

Here’s how Canadian agriculture has functioned during the first 18 years of the twenty-first century (2000 to 2017, inclusive):

1. Overall, farmers earned, on average, $47 billion per year in gross revenues from the markets (these are gross receipts from selling crops, livestock, vegetables, honey, maple syrup, and other products).

2. After paying expenses, on average, farmers were left with $1.6 billion per year in realized net farm income from the markets (excluding farm-support program payments).  If that amount was divided equally among Canada’s 193,492 farms, each would get about $8,300.

3. To help make ends meet, Canadian taxpayers transferred to farmers $3.1 billion per year via farm-support-program payments.

4. On top of this, farmers borrowed $2.7 billion per year in additional debt.

5. Farm family members worked at off-farm jobs to earn most of the household income needed to support their families (for data see here and here).

The numbers above give rise to several observations:

A. The amount of money that farmers pay each year in interest to banks and other lenders ($3 billion, on average) is approximately equal to the amount that Canadian citizens each year pay to farmers ($3.1 billion).  Thus, one could say that, in effect, taxpayers are paying farmers’ interest bills.  Governments are facilitating the transfer of tax dollars from Canadian families to farmers and on to banks and their shareholders.

B. Canadian farmers probably could not service their $100 billion dollar debt without government/taxpayer funding.

C. To take a different perspective: each year farmers take on additional debt ($2.7 billion, on average) approximately equal to the amount they are required to pay in interest to banks ($3 billion on average). One could say that for two decades banks have been loaning farmers the money needed to pay the interest on farmers’ tens-of-billions of dollars in farm debt.

Over and above the difficulty in paying the interest, is the difficulty in repaying the principle.  Farm debt now—$102 billion—is equal to approximately 64 years of farmers’ realized net farm income from the markets.  To repay the current debt, Canadian farm families would have to hand over to banks and other lenders every dime of net farm income from the markets from now until 2082.

The Canadian farm sector has many strengths.  By many measures, the sector is extremely successful and productive.  Over the past generation, farmers have managed to nearly double the value of their output and triple the value of agri-food exports.  Output per year, per farmer, and per acre are all up dramatically.  And Canadian farmers lead the world in adopting high-tech production systems.  The problem is not that our farms are backward, inefficient, or unproductive.  Rather, the problems detailed above are the result of voracious wealth extraction by the dominant agribusiness transnationals and banks. (To examine the extent of that wealth extraction, see my blog post here).

Although our farm sector has many strengths and is setting production records, the sector remains in a crisis that began in the mid-1980s.  And what began as a farm income crisis has metastasized into a farm debt crisis.  Further, the sector also faces a generational crisis (the number of farmers under the age of 35 has been cut by half since 2001) and a looming climate crisis.  Policy makers must work with farmers to rapidly restructure and transform Canadian agriculture.  A failure to do so will mean further costs to taxpayers, the destruction of the family farm, and irreparable damage to Canada’s food-production system.

Civilization as asteroid: humans, livestock, and extinctions

Graph of biomass of humans, livestock, and wild animals
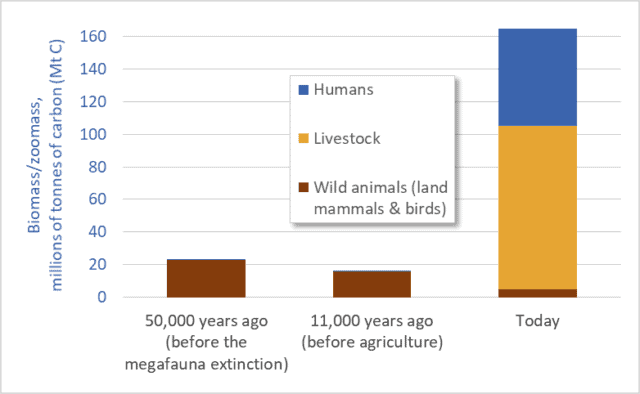
Mass of humans, livestock, and wild animals (terrestrial mammals and birds)

Humans and our livestock now make up 97 percent of all animals on land.  Wild animals (mammals and birds) have been reduced to a mere remnant: just 3 percent.  This is based on mass.  Humans and our domesticated animals outweigh all terrestrial wild mammals and birds 32-to-1.

To clarify, if we add up the weights of all the people, cows, sheep, pigs, horses, dogs, chickens, turkeys, etc., that total is 32 times greater than the weight of all the wild terrestrial mammals and birds: all the elephants, mice, kangaroos, lions, raccoons, bats, bears, deer, wolves, moose, chickadees, herons, eagles, etc.  A specific example is illuminating: the biomass of chickens is more than double the total mass of all other birds combined.

Before the advent of agriculture and human civilizations, however, the opposite was the case: wild animals and birds dominated, and their numbers and mass were several times greater than their numbers and mass today. Before the advent of agriculture, about 11,000 years ago, humans made up just a tiny fraction of animal biomass, and domesticated livestock did not exist.  The current situation—the domination of the Earth by humans and our food animals—is a relatively recent development.

The preceding observations are based on a May 2018 report by Yinon Bar-On, Rob Phillips, and Ron Milo published in the academic journal Proceedings of the National Academy of Sciences.  Bar-On and his coauthors use a variety of sources to construct a “census of the biomass of Earth”; they estimate the mass of all the plants, animals, insects, bacteria, and other living things on our planet.

The graph above is based on data from that report (supplemented with estimates based on work by Vaclav Smil).  The graph shows the mass of humans, our domesticated livestock, and “wild animals”: terrestrial mammals and birds.  The units are millions of tonnes of carbon.*  Three time periods are listed.  The first, 50,000 years ago, is the time before the Quaternary Megafauna Extinction.  The Megafauna Extinction was a period when Homo sapiens radiated outward into Eurasia, Australia, and the Americas and contributed to the extinction of about half the planet’s large animal species (>44 kgs).  (Climate change also played a role in that extinction.)  In the middle of the graph we see the period around 11,000 years ago—before humans began practicing agriculture.  At the right-hand side we see the situation today.  Note how the first two periods are dominated by wild animals.  The mass of humans in those periods is so small that the blue bar representing human biomass is not even visible in the graph.**

This graph highlights three points:
1. wild animal numbers and biomass have been catastrophically reduced, especially over the past 11,000 years;
2. human numbers and livestock numbers have skyrocketed, to unnatural, abnormal levels; and
3. The downward trendline for wild animals visible in this graph is gravely concerning; this graph suggests accelerating extinctions.

Indeed, we are today well into the fastest extinction event in the past 65 million years.  According to the 2005 Millennium Ecosystem Assessment “the rate of known extinctions of species in the past century is roughly 50–500 times greater than the extinction rate calculated from the fossil record….”

The extinction rate that humans are now causing has not been seen since the Cretaceous–Paleogene extinction event 65 million years ago—the asteroid-impact-triggered extinction that wiped out the dinosaurs.  Unless we reduce the scale and impacts of human societies and economies, and unless we more equitably share the Earth with wild species, we will enter fully a major global extinction event—only the sixth in 500 million years.  To the other species of the Earth, and to the fossil record, human impacts increasingly resemble an asteroid impact.

In addition to the rapid decline in the mass and number of wild animals it is also worth contemplating the converse: the huge increase in human and livestock biomass.  Above, I called this increase “unnatural,” and I did so advisedly.  The mass of humans and our food animals is now 7 times larger than the mass of animals on Earth 11,000 or 50,000 years ago—7 times larger than what is normal or natural.  For millions of years the Earth sustained a certain range of animal biomass; in recent millennia humans have multiplied that mass roughly sevenfold.

How?  Fossil fuels.  Via fertilizers, petro-chemical pesticides, and other inputs we are pushing hundreds of millions of tonnes of fossil fuels into our food system, and thereby pushing out billions of tonnes of additional food and livestock feed.  We are turning fossil fuel Calories from the ground into food Calories on our plates and in livestock feed-troughs.   For example, huge amounts of fossil-fuel energy go into growing the corn and soybeans that are the feedstocks for the tens-of-billions of livestock animals that populate the planet.

Dr. Anthony Barnosky has studied human-induced extinctions and the growing dominance of humans and their livestock.  In a 2008 journal article he writes that “as soon as we began to augment the global energy budget, megafauna biomass skyrocketed, such that we are orders of magnitude above the normal baseline today.”  According to Barnosky “the normal biomass baseline was exceeded only after the Industrial Revolution” and this indicates that “the current abnormally high level of megafauna biomass is sustained solely by fossil fuels.”

Only a limited number of animals can be fed from leaves and grass energized by current sunshine.  But by tapping a vast reservoir of fossil sunshine we’ve multiplied the number of animals that can be fed.  We and our livestock are petroleum products.

There is no simple list of solutions to mega-problems like accelerating extinctions, fossil-fuel over-dependence, and human and livestock overpopulation.  But certain common sense solutions seem to present themselves.  I’ll suggest just one: we need to eat less meat and fewer dairy products and we need to reduce the mass and number of livestock on Earth.  Who can look at the graph above and come to any other conclusion?  We need not eliminate meat or dairy products (grazing animals are integral parts of many ecosystems) but we certainly need to cut the number of livestock animals by half or more.  Most importantly, we must not try to proliferate the Big Mac model of meat consumption to 8 or 9 or 10 billion people.  The graph above suggests a stark choice: cut the number of livestock animals, or preside over the demise of most of the Earth’s wild species.


* Using carbon content allows us to compare the mass of plants, animals, bacteria, viruses, etc.  Very roughly, humans and other animals are about half to two-thirds water.  The remaining “dry mass” is about 50 percent carbon.  Thus, to convert from tonnes of carbon to dry mass, a good approximation is to multiply by 2.

** There is significant uncertainty regarding animal biomass in the present, and much more so in the past.  Thus, the biomass values for wild animals in the graph must be considered as representing a range of possible values.  That said, the overall picture revealed in the graph is not subject to any uncertainty.  The overall conclusions are robust: the mass of humans and our livestock today is several times larger than wild animal biomass today or in the past; and wild animal biomass today is a fraction of its pre-agricultural value.

Graph sources:
– Yinon M. Bar-On, Rob Phillips, and Ron Milo, “The Biomass Distribution on Earth,” Proceedings of the National Academy of Sciences, May 17, 2018.
– Anthony Barnosky, “Megafauna Biomass Tradeoff as a Driver of Quaternary and Future Extinctions,” Proceedings of the National Academy of Sciences 105 (August 2008).
– Vaclav Smil, Harvesting the Biosphere: What We Have Taken from Nature (Cambridge, MA: MIT Press, 2013).

The cattle crisis: 100 years of Canadian cattle prices

Graph of Canadian cattle prices, historic, 1918-2018
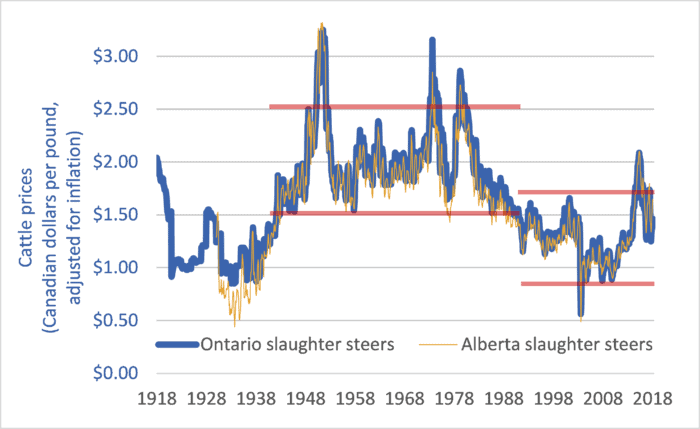
Canadian cattle prices at slaughter, Alberta and Ontario, 1918-2018

Earlier this month, Brazilian beef packer Marfrig Global Foods announced it is acquiring 51 percent ownership of US-based National Beef Packing for just under $1 billion (USD).  The merged entity will slaughter about 5.5 million cattle per year, making Marfrig/National the world’s fourth-largest beef packer.  (The top-three are JBS, 17.4 million per year; Tyson, 7.7 million; and Cargill, 7.6.)  To put these numbers into perspective, with the Marfrig/National merger, the largest four packing companies will together slaughter about 15 times more cattle worldwide than Canada produces in a given year.  In light of continuing consolidation in the beef sector it is worth taking a look at how cattle farmers and ranchers are fairing.

This week’s graph shows Canadian cattle prices from 1918 to 2018.  The heavy blue line shows Ontario slaughter steer prices, and is representative of Eastern Canadian cattle prices.  The narrower tan-coloured line shows Alberta slaughter steer prices, and is representative for Western Canada.  The prices are in dollars per pound and they are adjusted for inflation.

The two red lines at the centre of the graph delineate the price range from 1942 to 1989.  The red lines on the right-hand side of the graph delineate prices since 1989.  The difference between the two periods is stark.  In the 47 years before 1989, Canadian slaughter steer prices never fell below $1.50 per pound (adjusted for inflation).  In the 28 years since 1989, prices have rarely risen that high.  Price levels that used to mark the bottom of the market now mark the top.

What changed in 1989?  Several things:

1.       The arrival of US-based Cargill in Canada in that year marked the beginning of integration and consolidation of the North American continental market.  This was later followed by global integration as packers such as Brazil-based JBS set up plants in Canada and elsewhere.

2.       Packing companies became much larger but packing plants became much less numerous.  Gone were the days when two or three packing plants in a given city would compete to purchase cattle.

3.       Packer consolidation and giantism was faciliated by trade agreements and global economic integration.  It was in 1989 that Canada signed the Canada-US Free Trade Agreement (CUSTA).  A few years later Canada would sign the NAFTA, the World Trade Organization (WTO) Agreement on Agriculture, and other bilateral and multilateral “free trade” deals.

4.       Packing companies created captive supplies—feedlots full of packer-owned cattle that the company could draw from if open-market prices rose, curtailing demand for farmers’ cattle and disciplining prices.

Prices and profits are only partly determined by supply and demand.  A larger factor is market power.  It is this power that determines the allocation of profits within a supply chain.  In the late ’80s and continuing today, the power balance between packers and farmers shifted as packers merged to become giant, global corporations.  The balance shifted as packing plants became less numerous, reducing competition for farmers’ cattle.  The balance shifted still further as packers began to utilize captive supplies.  And it shifted further still as trade agreements thrust farmers in every nation into a single, hyper-competitive global market.  Because market power determines profit allocation, these shifts increased the profit share for packers and decreased the share for farmers.   The effects on cattle farmers have been devastating.  Since the latter-1980s, Canada has lost half of its cattle farmers and ranchers.

For more background and analysis, please see the 2008 report by the National Farmers Union: The Farm Crisis and the Cattle Sector: Toward a New Analysis and New Solutions.

Graph sources: numerous, including Statistics Canada CANSIM Tables 002-0043, 003-0068, 003-0084; and  Statistics Canada “Livestock and Animal Products”, Cat. No. 23-203


Earth’s dominant bird: a look at 100 years of chicken production

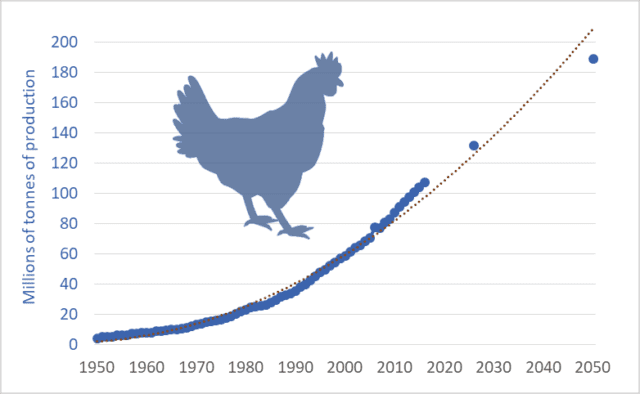
Graph of Chicken production, 1950-2050
Chicken meat production, global, actual and projected, 1950 to 2050

There are approximately 23 billion chickens on the planet right now.   But because the life of a meat chicken is short—less than 50 days—annual production far exceeds the number of chickens alive at any one time.  In 2016, worldwide, chicken production topped 66 billion birds.  Humans are slaughtering, processing, and consuming about 2,100 chickens per second.

We’re producing a lot of chicken meat: about 110 million tonnes per year.  And we’re producing more and more.  In 1966, global production was 10 million tonnes.  In just twelve years, by 1978, we’d managed to double production.  Fourteen years after that, 1992, we managed to double it again, to 40 million tonnes.  We doubled it again to 80 million tonnes by 2008.  And we’re on track for another doubling—a projected 160 million tonnes per year before 2040.  By mid-century, production should exceed 200 million tonnes—20 times the levels in the mid-’60s.  This week’s graph shows the steady increase in production.  Data sources are listed below.

The capacity of our petro-industrial civilization to double and redouble output is astonishing.  And there appears to be no acknowledged limit.  Most would predict that as population and income levels rise in the second half of the century—as another one or two billion people join the “global middle class”—that consumption of chicken and other meats will double again between 2050 and 2100.  Before this century ends, consumption of meat (chicken, pork, beef, lamb, farmed fish, and other meats) may approach a trillion kilograms per year.

Currently in Canada the average chicken farm produces about 325,000 birds annually.  Because these are averages, we can assume that the output of the largest operations is several times this figure.  In the US, chicken production is dominated by contracting.  Large transnationals such as Tyson Foods contract with individual growers to feed birds.  It is not unusual for a contract grower to have 6 to 12 barns on his or her farm and raise more than a million broiler chickens per year.

We’re probably making too many McNuggets.  We’re probably catching too many fish.  We’re probably feeding too many pigs.  And it is probably not a good idea to double the number of domesticated livestock on the planet—double it to 60 billion animals.  It’s probably time to rethink our food system.  

Graph sources:
FAOSTAT database
OECD-FAO, Agricultural Outlook 2017-2026
Brian Revell: One Man’s Meat … 2050?
Lester Brown: Full Planet, Empty Plates
FAO: World Agriculture Towards 2030/2050, the 2012 revision

The 100th Anniversary of high-input agriculture

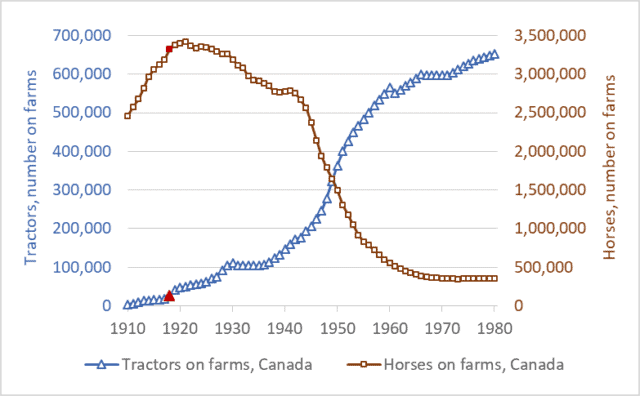
Graph of tractor and horse numbers, Canada, historic, 1910 to 1980
Tractors and horses on farms in Canada, 1910 to 1980

2018 marks the 100th anniversary of the beginning of input-dependent farming—the birth of what would become modern high-input agriculture.  It was in 1918 that farmers in Canada and the US began to purchase large numbers of farm tractors.  These tractors required petroleum fuels.  Those fuels became the first major farm inputs.  In the early decades of the 20th century, farmers became increasingly dependent on fossil fuels, in the middle decades most also became dependent on fertilizers, and in the latter decades they also became dependent on agricultural chemicals and high-tech, patented seeds.

This week’s graph shows tractor and horse numbers in Canada from 1910 to 1980.  On both lines, the year 1918 is highlighted in red.  Before 1918, there were few tractors in Canada.  The tractors that did exist—mostly large steam engines—were too big and expensive for most farms.  But in 1918 three developments spurred tractor proliferation: the introduction of smaller, gasoline-engine tractors (The Fordson, for example); a wartime farm-labour shortage; and a large increase in industrial production capacity.  In the final year of WWI and in the years after, tractor sales took off.  Shortly after, the number of horses on farms plateaued and began to fall.  Economists Olmstead and Rhode have produced a similar graph for the US.

It’s important to understand the long-term significance of what has unfolded since 1918.  Humans have practiced agriculture for about 10,000 years—about 100 centuries.  For 99 centuries, there were almost no farm inputs—no industrial products that farmers had to buy each spring in order to grow their crops.  Sure, before 1918, farmers bought farm implements—hoes, rakes, and sickles in the distant past, and plows and binders more recently.  And there were some fertilizer products available, such as those derived from seabird guano (manure) in the eighteenth and nineteenth centuries.  And farmers occasionally bought and sold seeds.  But for most farmers in most years before about 1918, the production of a crop did not require purchasing an array of farm inputs.  Farm chemicals did not exist, very little fertilizer was available anywhere in the world until after WWII, and farmers had little use for gasoline or diesel fuel.  Before 1918, farms were largely self-sufficient, deriving seeds from the previous years’ crop, fertility from manure and nitrogen-fixing crops, and pulling-power from horses energized by the hay and grain that grew on the farm itself.  For 99 of the 100 centuries that agriculture has existed, farms produced the animal- and crop-production inputs they needed.  Nearly everything that went into farming came out of farming.

For 99 percent of the time that agriculture has existed there were few farm inputs, no farm-input industries, and little talk of “high input costs.”  Agricultural production was low-input, low-cost, solar-powered, and low-emission.  In the most recent 100 years, however, we’ve created a new kind of agricultural system: one that is high-input, high-cost, fossil-fuelled, and high-emission.

Modern agriculture is also, admittedly, high-output.  But this last fact must be understood in context: the incredible food-output tonnage of modern agriculture is largely a reflection of the megatonnes of fertilizers, fuels, and chemicals we push into the system.  Nitrogen fertilizer illustrates this process.  To produce, transport, and apply one tonne of synthetic nitrogen fertilizer requires an amount of energy equal to almost two tonnes of gasoline.  Modern agriculture is increasingly a system for turning fossil fuel Calories into food Calories.  Food is increasingly a petroleum product.

The high-input era has not been kind to farmers.  Two-thirds of Canadian farmers have been ushered out of agriculture over the past two generations.  More troubling and more recent: the number of young farmers—those under 35—has been reduced by two-thirds since 1991.  Farm debt is at a record high: nearly $100 billion.  And about the same amount, $100 billion, has had to be transferred from taxpayers to farmers since the mid-1980s to keep the Canadian farm sector afloat.  Farmers are struggling with high costs and low margins.

This is not a simplistic indictment of “industrial agriculture.”  We’re not going back to horses.  But on the 100th anniversary of the creation of fossil-fuelled, high-input agriculture we need to think clearly and deeply about our food production future.  As our fossil-fuel supplies dwindle, as greenhouse gas levels rise, as we struggle to feed and employ billions more people, and as we struggle with many other environmental and economic problems, we will need to rethink and radically transform our food production systems.  Our current food system isn’t “normal”: it’s an anomaly—a break with the way that agriculture has operated for 99 percent of its history.  It’s time to ask hard questions and make big changes.  It’s time to question the input-maximizing production systems agribusiness corporations have created, and to explore new methods of low-input, low-energy-use, low-emission production.

Rather than maximizing input use, we need to maximize net farm incomes, maximize the number of farm families on the land, and maximize the resilience and sustainability of our food systems.

Cattle Rustling? The growing gap between cattle and beef prices

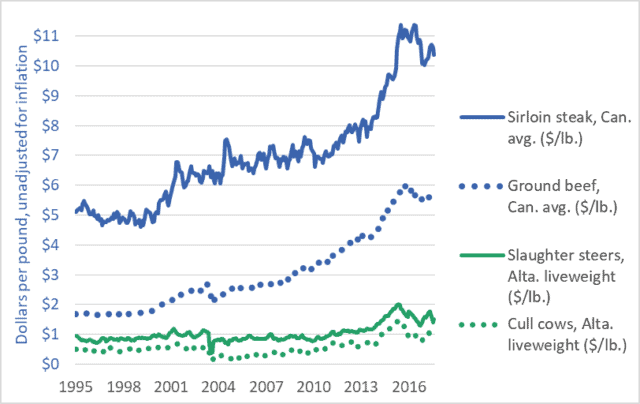
Graph of Canadian cattle prices and retail beef prices, 1995 to 2017
Retail prices of ground beef and steak compared to farmers’ prices for cattle, 1995–2017

This week’s graph highlights the growing gap between what Canadians pay for beef and what farmers receive for their cattle.  The rising blue lines show grocery-store prices for steak and ground beef.  The comparatively flat green lines represent the prices farmers and feedlot operators receive for the cattle they sell to beef packers.  Steers (castrated male cattle) are more likely to be the source of steaks, while cows are primarily turned into ground beef.

The blue lines show what consumers pay; the green lines show what farmers get.  The widening gap between the blue lines and the green lines reveals the amount that packers and retailers take for themselves.

Let’s look first at the dotted lines.  The green dotted line shows the per-pound price farmers in Alberta receive for their cows.  (prices across Canada are similar.)  In the decade-and-a-half before 2010, that price averaged about 50¢.  In recent years it has averaged about $1.00.  One could say that farmers are receiving an extra 50¢ per pound for their cows.  These figures do not take into account rising costs (they are not adjusted for inflation) but we’ll leave that issue aside for now.  Note what happens to the blue dotted line: the grocery-store price of ground beef.  It more than triples, from about $1.70 per pound to about $5.50.  Farmers’ prices increased by 100%, but packers and retailers increased their take by 320%.  Farmers’ prices increased by 50¢, but packers and retailers increased their prices by nearly $4.00.

The solid green line shows the price that farmers (or feedlot operators) receive for slaughter-ready steers.  The solid blue line is a representative price for grocery-store steaks.  If we compare recent years to those before 2013, we see that steer prices have risen by perhaps 50¢ or 60¢ per pound.  Over the same period, steak prices have risen by $5.00 or $6.00.

There is little discernible connection between the prices consumers pay and the prices farmers receive.  This is true of cattle and beef, but also true of nearly every other farm-retail product pair.  For a graph comparing the prices of wheat and bread, click here.  Similar “wedge” graphs can be created for corn and cornflakes, hogs and pork chops, and many other farm-retail product pairs.

Food processors, packers, and retailers are choking off the flow of dollars to Canadian farms, with devastating effects.  The number of Canadian farms raising cattle has been cut nearly in half in a generation—from 142,000 in 1995 to less than 75,000 today.  Moreover, many of these farms reporting cattle are dairy farms (which do sell cattle for slaughter, but support themselves primarily from milk sales).  The number of farms classified as “beef cattle ranching and farming, including feedlots” stood at just 36,000 in 2016.  Farm debt is a record $100 billion.  And the number of young farmers (<35 years of age) today is just one-third the number a generation ago.

Canadians are paying many times over.  We’re paying a high price at the store.  We’re paying again through our taxes to fund farm support programs—money paid to farmers to backfill for the dollars extracted by powerful transnational packers, processors, and retailers.  And we’re paying yet again as our rural economies are hollowed out, our communities decimated, our family farms destroyed, and our nation’s capacity to sustainably produce food is eroded.

Graph sources: Statistics Canada CANSIM Tables 326-0012 and 002-0043.