Greta vs. growth

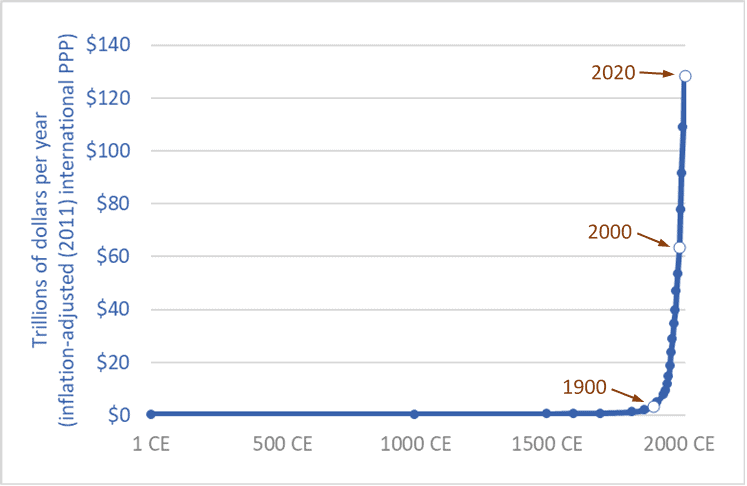
Graph of the size of the global economy (Gross World Product) historic
The size of the global economy (Gross World Product) over the long term, 1 CE – 2020 CE

“People are suffering.  People are dying.  Entire ecosystems are collapsing.  We are in the beginning of a mass extinction, and all you can talk about is money and fairy tales of eternal economic growth.  How dare you!”  So spake Greta Thunberg at the United Nations on September 23rd, 2019.

Thunberg, a sixteen-year-old without a university education, has had the insight, clarity, and courage to say what ten-billion-dollars worth of Ph.D. economists haven’t: that continued economic growth is, at best, unsustainable and probably much worse: a malignant illusion driving us to destroy our biosphere, civilization, and future.  The project of making the current global economy four or eight times larger is a suicide pact.

The graph above places our 21st century economy in its long-term context.  It shows the size of the global economy (Gross World Product) from 1 CE to 2020.  The units are trillions of US/international dollars adjusted for inflation (constant 2011 dollars).  The main source is the World Bank, with historical data from Angus Maddison.  (Pre-20th century values are, by necessity, estimates by Maddison.)

The years 1900, 2000, and 2020 are highlighted.  Sometime in 2020 the size of the global economy will surpass 127 trillion dollars.  When it does, it will be twice as large as it was in 2000.  The economy will have doubled in size in just 20 years.  This shouldn’t be a surprise.  Sustained growth rates of 3.5 percent leads to a doubling every 20 years.  (Recall the Rule of 70.)

Going forward, if we maintain current rates of growth—three to four percent annually—the economy will be twice as large again by 2040 or soon after—making it four times larger than in 2000.  Earth’s atmosphere, oceans, land, and biosphere will be hosting four 2000-sized economies.

And by 2060 or 2070, another doubling will bring the global economy to eight times its 2000 level.  And there’ll still be more than enough time left in this century to double it again—at least a 16-fold increase in size in a single century, if we stay the course.  If we accomplish this, we will be reprising the 18-fold increase seen during the 20th century.

Of course, we won’t do this—we won’t make the global economy 8 or 16 times larger.  Within a generation or two nearly everyone on the planet will be living in a post-growth economy: either because we’ve had the wisdom to end runaway exponential growth and put the biosphere first, or because we have not.

The end of growth, inescapable in the medium term, will bring numerous problems, such as how will we deal with the equity claims of the poor if we can no longer rely on the convenient fictions of “a rising tide raises all boats” and “anyone (everyone?) can grow up to be rich.”  While the end of growth must come for nearly all within a few decades, it must come first for those of us who are richest, so that growth can continue in places where people are poorer.  Those of us who enjoy jet vacations need to step off the growth escalator first so that growth can continue for others and deliver to them running water and refrigerators.  The end of growth casts into sharp relief a series of moral problems.

But the end of growth will also solve many problems.  We will be forced to take less of our economy’s productivity and bounty in the form of consumer products and more in the form of free time and low-emission leisure—more time with family, more time with friends drinking coffee or wine, more time with culture and nature; more discussion, poetry, romance, literature, and contemplation.  Most of the people in the fast-expanding (-metasticizing?) global middle class are living high-stress, low-quality, time-impoverished lives.  Stepping off the growth escalator can be part of a larger civilizational, cultural, and spiritual shift in which we rediscover meaning and purpose beyond getting and spending.

Thunberg is neither sage nor prophet.  And one need be neither to see what is absolutely, inescapably obvious: growth must and will soon end.  But we have a choice: We can deny the fact of growth’s imminent end and continue in the fairy tale and massively deplete and damage the planet in a last frenzied attempt to squeeze out one or two more doublings, or we can be as mature as a sixteen-year-old, admit the obvious, get on with the needed changes, and reap the benefits of slower, saner, more sustainable, more enjoyable lives.

Sources for graph:
– 
World Bank, Databank website: “GDP, PPP (constant 2011 international $)”
– 
Angus Maddison, The World Economy, Volume 1: A Millennial Perspective (Paris: OECD, 2001); Angus Maddison, Contours of the World Economy, 1–2030 AD: Essays in Macro-Economic History (Oxford: Oxford University Press, 2007)



Another trillion tonnes: 250 years of global material use data

Graph of Global materials use 1850-2100
Global materials use, 1850-2100

Want to understand your society and economy and the fate of petro-industrial civilization?  If so, don’t “follow the money.”  The stock market casino, quantitative easing, derivatives and other “financial innovations,” and the trillions of e-dollars that flit through the global monetary system each day obscure the real economy—the production and destruction of actual wealth: mining, farming, processing, transport, manufacturing, consumption, disposal.  To understand where we are and where we may be going, we must follow more tangible flows—things that are real.  We must follow the oil, coal, steel, concrete, grain, copper, fertilizers, salt, gravel, and other materials.

Our cars, homes, phones, foods, fuels, clothes, and all the other products we consume or aspire to are made out of stuff—out of materials, out of wood, iron, cotton, etc.   And our economies consume enormous quantities of those materials—tens-of-billions of tonnes per year.

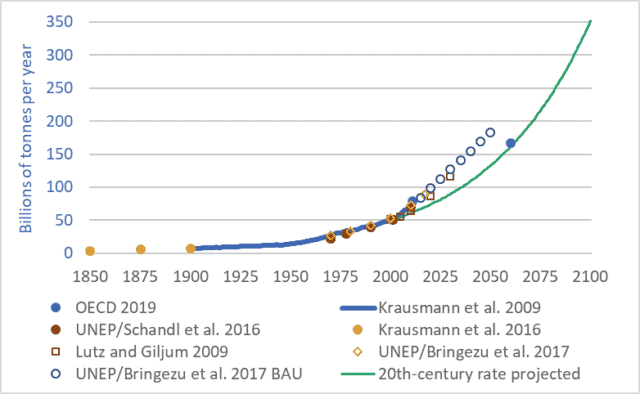
The graph above shows 250 years of actual and projected material flows through our global economy.  The graph may initially appear complicated, because it brings together seven different sources and datasets and includes a projection to the year 2100.  But the details of the graph aren’t important.  What is important is the overall shape: the ever-steepening upward trendline—the exponential growth.

In 1900, global material flows totalled approximately 7 billion tonnes.  The technical term for these material flows is “utilized materials”—the stuff we dig out of mines, pump up from oil or natural gas wells, cut down in forests, grow on farms, catch from the sea, dig out of quarries, and otherwise appropriate for human uses.  These tonnages do not include water, nor do they include unused overburden, but they do include mine tailings, though this last category adds just a few percent to the total.

Between 1900 and 2000, global material tonnage increased sevenfold—to approximately 49 billion tonnes (Krausman et al. 2009).  Tonnage rose to approx. 70 billion tonnes by 2010 (UNEP/Schandl 2016), and to approx. 90 billion tonnes by 2018 (UNEP/Bringezu 2018).  At the heart of our petro-industrial consumerist civilization is a network of globe-spanning conveyors that, each second, extract and propel nearly 3,000 tonnes of materials from Earth’s surface and subsurface to factories, cities, shops, and homes, and eventually on to landfills, rivers and oceans, and the atmosphere.  At a rate of a quarter-billion tonnes per day we’re turning the Earth and biosphere into cities, homes, products, indulgences, and fleeting satisfactions; and emissions, by-products, toxins, and garbage.

And these extraction, consumption, and disposal rates are projected to continue rising—to double every 30 to 40 years (Lutz and Giljum 2009).  Just as we increased material use sevenfold during the 20th century we’re on track to multiply it sevenfold during the 21st.  If we maintain the “normal” economic growth rates of the 20th century through the 21st we will almost certainly increase the volume and mass of our extraction, production, and disposal sevenfold by 2100.

But 2100 is a long way away.  Anything could happen by then.  Granted.  So let’s leave aside the long-term and look only at the coming decade.  Material throughput now totals about 90 billion tonnes per year, and is projected to rise to about 120 billion tonnes per year over the coming decade.  For ease of math, let’s say that the average over the coming decade will be 100 billion tonnes per year.  That means that between 2019 and 2029 we will extract from within the Earth and from the biosphere one trillion tonnes of materials: coal, oil, wood, fish, nickel, aluminum, chromium, uranium, etc.  …one trillion tonnes.  And we’ll send most of that trillion tonnes on into disposal in the ground, air, or water—into landfills, skyfills, and seafills.  In the coming decade, when you hear ever-more-frequent reports of the oceans filling with plastic and the atmosphere filling with carbon, think of that trillion tonnes.

Postscript: “dematerialization”

At conferences and in the media there’s a lot of talk of “dematerialization,” and its cousin “decarbonization.”  The idea is this: creating a dollar of economic activity used to require X units of energy or materials, but now, in countries such as Canada and the United States, creating a dollar of economic activity requires only two-thirds-X units.  Pundits and officials would have us believe that, because efficiency is increasing and less material and energy are needed per dollar, the economy is being “dematerialized.”  They attempt to show that the economy can grow and grow but we need not use more materials or energy.  Instead of consuming heavy steel cars, we will consume apps, massages, and manicures.  But this argument is wrong.  Global material and energy use increased manyfold during the 20th century.  The increases continue.  A business-as-usual scenario will see energy and materials use double every 30 to 40 years.  And just because the sizes of our economies, measured in abstract currencies, are growing faster, this does not change the fact that our use of energy and materials is growing.  “Dematerialization” has no useful meaning in a global economy in which we are using 90 billion tonnes of materials per year and projecting the use of 180 billion tonnes by 2050.  Our rate of extraction and consumption of materials is rising; the fact that the volume of dollar flows is rising faster is merely a distraction.

Sources for material flow tonnage:

Fridolin Krausmann et al., “Growth in Global Materials Use, GDP, and Population During the 20th Century,” Ecological Economics 68, no. 10 (2009).

Christian Lutz and Stefan Giljum, “Global Resource Use in a Business-as-Usual World: Updated Results from the GINFORS Model,” in Sustainable Growth and Resource Productivity: Economic and Global Policy Issues, ed. Bleischwitz et al. (Sheffield, UK: Greenleaf Publishing, 2009).

Stefan Giljum et al., Sustainable Europe Research Institute (SERI), “Resource Efficiency for Sustainable Growth: Global Trends and European Policy Scenarios,” background paper, delivered Sept. 10, 2009, in Manila, Philippines.

Julia Steinberger et al., “Global Patterns of Materials Use: A Socioeconomic and Geophysical Analysis,” Ecological Economics 69, no. 5 (2010).

UN Environmental Programme (UNEP) and H. Schandl et al., Global Material Flows and Resource Productivity: An Assessment Study of the UNEP International Resource Panel (Paris: UNEP, 2016).

Krausmann et al., “Long-term Trends in Global Material and Energy Use,” in Social Ecology: Society-Nature Relations across Time and Space, ed. Haberl et al. (Switzerland: Springer, 2016).

United Nations Environment Programme (UNEP), International Resource Panel, and Stefan Bringezu et al., Assessing Global Resource Use: A Systems Approach to Resource Efficiency and Pollution Reduction (Nairobi: UNEP, 2017).

Organization for Economic Cooperation and Development (OECD), Global Material Resources Outlook to 2060: Economic Drivers and Environmental Consequences (Paris: OECD Publishing, 2019)

Moore’s Law and me

Graph of Transistor count and Moore's Law, 1970-2016
Transistor count and Moore's Law, 1970-2016

In 1985 I bought an Apple Macintosh computer.  It cost $3,500 ($7,000 in today’s dollars).  Soon after, Apple and other companies started selling external hard-disk drives for the Mac.  They, too, were expensive.  But in 1986 or ’87 the price for a hard disk came down to an “affordable” $2,000, and I and many Mac owners were tempted.  In the mid-1980s, a 20-megabyte (MB) hard drive cost $2,000 ($4,000 in today’s dollars).  That’s $200 per MB (in today’s dollars).

Fast forward to 2018.  On my way home last week I stopped by an office-supply store and paid $139 for a 4 terabyte (TB) hard drive.  That’s $34 per TB.

What would that 4 TB hard drive have cost me if prices had remained the same as in the 1980s?  Well, one terabyte is equal to a million megabytes.  So, that 4 TB drive contains 4 million MBs.  At $200 per MB (the 1980s price) the hard drive I picked up from Staples would have cost me $800 million dollars—not much under a billion once I paid sales taxes.  But it didn’t cost that: it was just $139.  Hard disk storage capacity has become millions of times cheaper in just over a generation.  Or, to put it another way, for the same money I can buy millions of times more storage.

I can reprise these same cost reductions, focusing on computer memory rather than hard disk capacity.  My 1979 Apple II had 16 kilobytes of memory.  My recently purchased Lenovo laptop has 16 gigabytes—a million times more.  Yet my new laptop cost a fraction of the inflation-adjusted prices of that Apple II.  Computer memory is millions of times cheaper.  The same is true of processing power—the amount of raw computation you can buy for a dollar.

The preceding trends have been understood for half a century—the basis for Moore’s Law.  Gordon Moore was a founder of Intel Corporation, one of the world’s leading computer processor and “chip” makers.  In 1965, Moore published a paper in which he observed that the number of transistors in computer chips was doubling every two years, and he predicted that this doubling would go on for some years to come.  (See this post for data on the astronomical rate of annual transistor production.)  Related to Moore’s Law is the price-performance ratio of computers.  Loosely stated, a given amount of money will buy twice as much computing power two or three years from now.

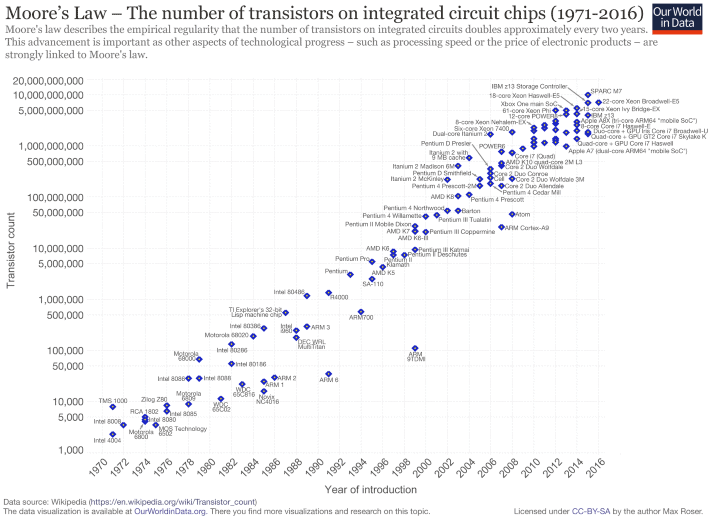
The graph above illustrates Moore’s Law and shows the transistor count for many important computer central processing units (CPUs) over the past five decades. (Here’s a link to a high-resolution version of the graph.)  Note that the graph’s vertical axis is logarithmic; what appears as a doubling is actually a far larger increase.  In the lower-left, the graph includes the CPU from my 1979 Apple II computer, the Motorola/MOS 6502.  That CPU chip contained about 3,500 transistors.  In the upper right, the graph includes the Intel i7 processor in my new laptop. That CPU contains about 2,000,000,000 transistors—roughly 500,000 times more than my Apple II.

Assuming a doubling every 2 years, in the 39 years between 1979 (my Apple II) and 2018 (My Lenovo) we should have seen 19.5 doublings in the number of transistors—about a 700,000-fold increase.  This number is close to the 500,000-fold increase calculated above by comparing the number of transistors in a 6502 chip to the number in an Intel i7 chip.  Moreover, computing power has increased even faster than the huge increases in transistor count would indicate.  Computer chips cycle faster today, and they also sport sophisticated math co-processors and graphics chips.

In terms of civilization and the future, the key questions include: can these computing-power increases continue?  Can the computers of the 2050s be hundreds-of-thousands of times more powerful than those of today?  Can we continue making transistors smaller and packing twice as many onto a chip every two years?  Can Moore’s Law continue unabated?  Probably not.  Transistors can only be made so small.  The rate of increase in computing power will slow.  We won’t see a million-fold increase in the coming 40 years like we saw in the past 40.  But does that matter?  What if the rate of increase in computing power fell by half—to a doubling every four years instead of every two?  That would mean that in 2050 our computers would still be 256 times more powerful than they are now.  And in 2054 they would be 512 times more powerful.  And in 2058, 1024 times more powerful.  What would it mean to our civilization if each of us had access to a thousand times more computing power?

One could easily add a last, pessimistic paragraph—noting the intersection between exponential increases in computing power, on the one hand, and climate change and resource limits, on the other.  But for now, let’s leave unresolved the questions raised in the preceding paragraph.  What is most important to understand is that technologies such as solar panels and massively powerful computers give us the option to move in a different direction.  But we have to choose to make changes.  And we have to act.  Our technologies are immensely powerful, but our efforts to use those technologies to avert calamity are feeble.  Our means are magnificent, but our chosen ends are ruinous.  Too often we become distracted by the novelty and power of our tools and fail to hone our skills to use those tools to build livable futures.


Electric car numbers, and projections to 2030

Graph of global electric vehicle numbers, 2013-17, and national data
Number of electric cars on the road, 2013 to 2017, and national data

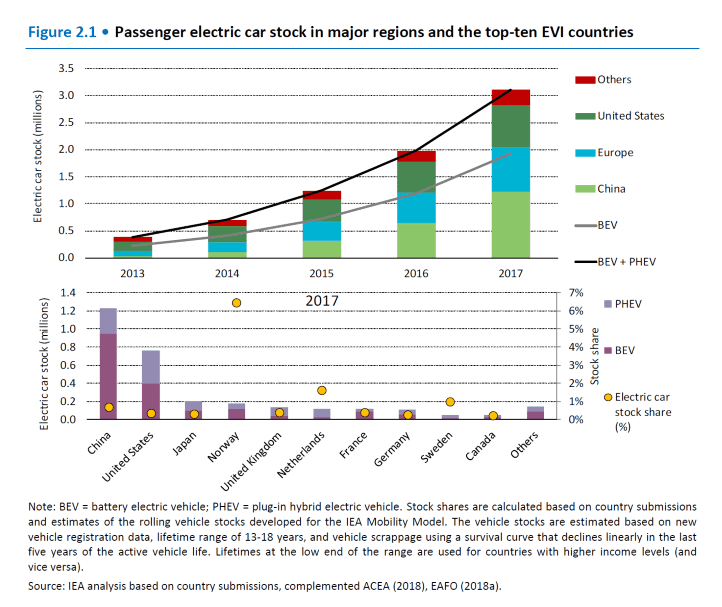
In just two years, 2013 to 2015, the number of electric cars worldwide more than doubled.  And in the following two years, 2015 to 2017, the number more than doubled again, to just over 3 million.  This exponential growth means that electric vehicles (EVs)* will soon make up a large portion of the global car fleet.

This week’s graph is reprinted from Global EV Outlook 2018, the latest in a series of annual reports compiled by the International Energy Agency (IEA).

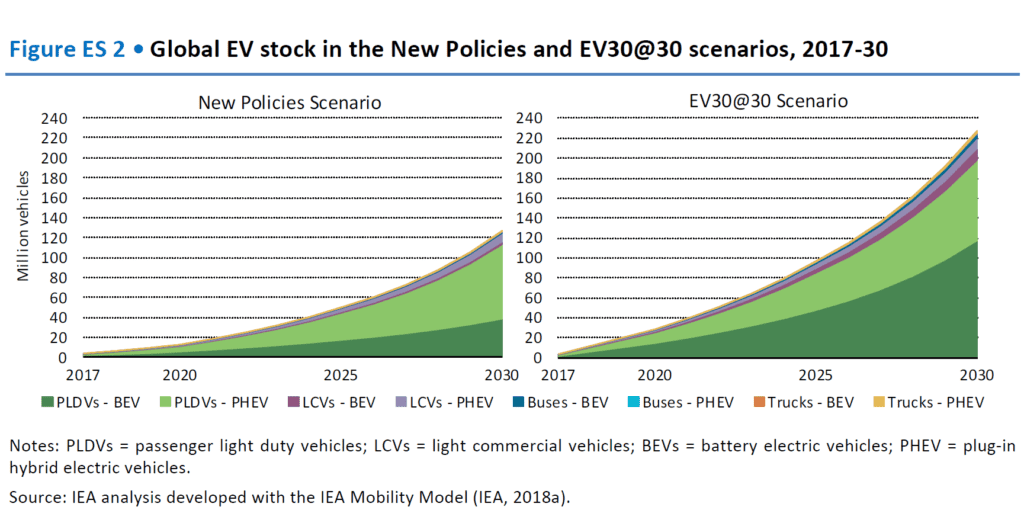
The graphs below show IEA projections of the number of EVs in the world by 2030 under two scenarios.  The first, the “New Policies Scenario,” takes into account existing and announced national policies.  Under this scenario, the number of EVs on the road is projected to reach 125 million by 2030.

The second scenario is called “EV30@30.”  This scenario is based on the assumption that governments will announce and implement new policies that will increase global EV penetration to 30 percent of new car sales by 2030—a 30 percent sales share.  This 30 percent share is roughly what is needed to begin to meet emission-reduction commitments made in the lead-up to the 2015 Paris climate talks.  Under this scenario, the number of EVs on the road could reach 228 million by 2030.

In either case, whether there are 125 million EV’s on the road in twelve years or 228 million, the result will be an impressive one, given that there were fewer than a million just four years ago.

Electric cars are not a panacea, but they do represent an important transition technology; electrifying much of the global car fleet can buy us the time we need to build zero-emission train and transit systems.  Thus, it is very important that we move very rapidly to maximize the number of EVs built and sold.  But the IEA is clear: EV adoption will depend on ambitious, effective government action.  The 228 million EVs projected under the EV30@30 Scenario will only exist if governments implement a suite of aggressive new policies.  The IEA states that:

“The uptake of electric vehicles is still largely driven by the policy environment.  The ten leading countries in electric vehicle adoption all have a range of policies in place to promote the uptake of electric cars.  Effective policy measures have proved instrumental in making electric vehicles more appealing to customers…, reducing risks for investors, and encouraging manufacturers to scale up production ….  Key examples of instruments employed by local and national governments to support EV deployment include public procurement programmes…, financial incentives to facilitate the acquisition of EVs and cut their usage cost (e.g. by offering free parking), and a variety of regulatory measures at different administrative levels, such as fuel-economy standards and restrictions on the circulation of vehicles based on tailpipe emissions performance.”

In 2018, about 95 million passenger cars and commercial vehicles were sold worldwide.  About 1 million were electric—about 1 percent.  The goal is to get to 30 percent in 12 years.  Attaining that goal, and thereby averting some of the worst effects of climate change, will require Herculean efforts by policymakers, regulators, international bodies, and automakers.

* There are two main types of EVs.  The first is plug-in hybrid electric vehicles (PHEVs).  These cars have batteries, can be plugged in, and can be driven a limited distance (usually tens of kilometres) using electrical power only, after which a conventional piston engine engages to charge the batteries or assist in propulsion.  Examples of PHEVs include the Chevrolet Volt and Toyota Prius Prime.  The second type is the battery electric vehicle (BEV).  BEVs have larger batteries, longer all-electric range (150 to 400 kms), and no internal combustion engines.  Examples of BEVs include the Chevrolet Bolt, Nissan Leaf, and several models from Tesla.  The term “electric vehicle” (EV) encompasses both PHEVs and BEVs.


Home grown: 67 years of US and Canadian house size data

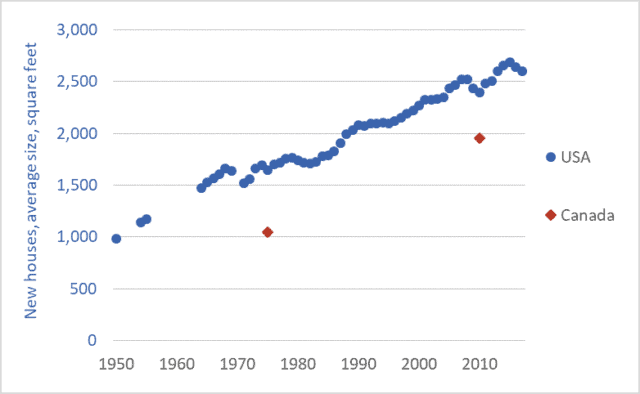
Graph of the average size of new single-family homes, Canada and the US, 1950-2017
Average size of new single-family homes, Canada and the US, 1950-2017

I was an impressionable young boy back in 1971 when my parents were considering building a new home.  I remember discussions about house size.  1,200 square feet was normal back then.  1,600 square feet, the size of the house they eventually built, was considered extravagant—especially in rural Saskatchewan.  And only doctors and lawyers built houses as large as 2,000 square feet.

So much has changed.

New homes in Canada and the US are big and getting bigger.  The average size of a newly constructed single-family detached home is now 2,600 square feet in the US and probably 2,200 in Canada.  The average size of a new house in the US has doubled since 1960.  Though data is sparse for Canada, it appears that the average size of a new house has doubled since the 1970s.

We like our personal space.  A lot.  Indeed, space per person has been growing even faster than house size.  Because as our houses have been growing, our families have been shrinking, and this means that per-capita space has increased dramatically.  The graph below, from shrinkthatfootprint.com, shows that, along with Australia, Canadians and Americans enjoy the greatest per-capita floorspace in the world.  The average Canadian or American each has double the residential space of the average UK, Spanish, or Italian resident.

Those of us fortunate enough to have houses are living in the biggest houses in the world and the biggest in history.  And our houses continue to get bigger.  This is bad for the environment, and our finances.

Big houses require more energy and materials to construct.  Big houses hold more furniture and stuff—they are integral parts of high-consumption lifestyles.  Big houses contribute to lower population densities and, thus, more sprawl and driving.  And, all things being equal, big houses require more energy to heat and cool.  In Canada and the US we are compounding our errors: making our houses bigger, and making them energy-inefficient.  A 2,600 square foot home with leading edge ‘passiv haus’ construction and net-zero energy requirements is one thing, but a house that size that runs its furnace half the year and its air conditioner the other half is something else.  And multiply that kind of house times millions and we create a ‘built in’ greenhouse gas emissions problem.

Then there are the issues of cost and debt.  We continually hear that houses are unaffordable.  Not surprising if we’re making them twice as large.  What if, over the past decade, we would have made our new houses half as big, but made twice as many?  Might that have reduced prices?

And how are large houses connected to large debt-loads?  Canadian debt now stands at a record $1.8 trillion.  Much of that is mortgage debt.  Even at low interest rates of 3.5 percent, the interest on that debt is $7,000 per year for a hypothetical family of four.  And that’s just the average.  Many families are paying a multiple of that amount, just in interest.  Then on top of that there are principle payments.  It’s not hard to see why so many families struggle to save for retirement or pay off debt.

Our ever-larger houses are filling the air with emissions; emptying our pockets of saving; filling up with consumer-economy clutter; and creating car-mandatory unwalkable, unbikable, unlovely neighborhoods.

The solutions are several fold.  First, new houses must stop getting bigger.  And they must start getting smaller.  There is no reason that Canadian and US residential spaces must be twice as large, per person, as European homes.  Second, building standards must get a lot better, fast.  Greenhouse gas emissions must fall by 50 to 80 percent by mid-century.  It is critical that the houses we build in 2020 are designed with energy efficient walls, solar-heat harvesting glass, and engineered summer shading such that they require 50 to 80 percent less energy to heat and cool.  Third, we need to take advantage of smaller, more rational houses to build more compact, walkable, bikable, enjoyable neighborhoods.  Preventing sprawl starts at home.

Finally, we need to consider questions of equity, justice, and compassion.  What is our ethical position if we are, on the one hand, doubling the size of our houses and tripling our per-capita living space and, on the other hand, claiming that we “can’t afford” housing for the homeless.  Income inequality is not just a matter of abstract dollars.  This inequality is manifest when some of us have rooms in our homes we seldom visit while others sleep outside in the cold.

We often hear about the “triple bottom line”: making our societies ecologically, economically, and socially sustainable.  Building oversized homes moves us away from sustainability, on all three fronts.

Graph sources:
US Department of Commerce/US Census Bureau, “2016 Characteristics of New Housing”
US Department of Commerce/US Census Bureau, “Characteristics of New Housing: Construction Reports”
US Department of Commerce/US Census Bureau, “Construction Reports: Characteristics of New One-Family Homes: 1969”
US Department of Labour, Bureau of Labour Statistics, “New Housing and its Materials:1940-56”
Preet Bannerjee, “Our Love Affair with Home Ownership Might Be Doomed,” Globe and Mail, January 18, 2012 (updated February 20, 2018) 

Earth’s dominant bird: a look at 100 years of chicken production

Graph of Chicken production, 1950-2050
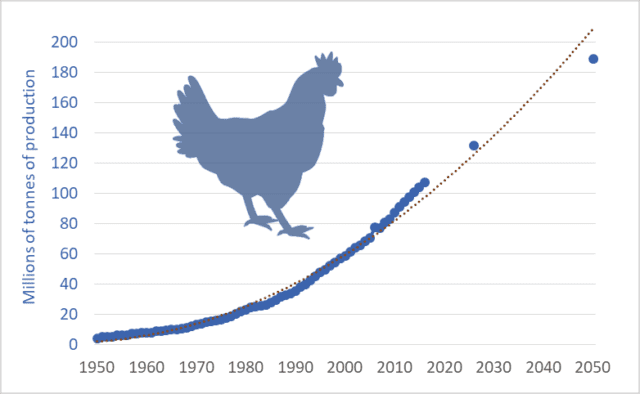
Chicken meat production, global, actual and projected, 1950 to 2050

There are approximately 23 billion chickens on the planet right now.   But because the life of a meat chicken is short—less than 50 days—annual production far exceeds the number of chickens alive at any one time.  In 2016, worldwide, chicken production topped 66 billion birds.  Humans are slaughtering, processing, and consuming about 2,100 chickens per second.

We’re producing a lot of chicken meat: about 110 million tonnes per year.  And we’re producing more and more.  In 1966, global production was 10 million tonnes.  In just twelve years, by 1978, we’d managed to double production.  Fourteen years after that, 1992, we managed to double it again, to 40 million tonnes.  We doubled it again to 80 million tonnes by 2008.  And we’re on track for another doubling—a projected 160 million tonnes per year before 2040.  By mid-century, production should exceed 200 million tonnes—20 times the levels in the mid-’60s.  This week’s graph shows the steady increase in production.  Data sources are listed below.

The capacity of our petro-industrial civilization to double and redouble output is astonishing.  And there appears to be no acknowledged limit.  Most would predict that as population and income levels rise in the second half of the century—as another one or two billion people join the “global middle class”—that consumption of chicken and other meats will double again between 2050 and 2100.  Before this century ends, consumption of meat (chicken, pork, beef, lamb, farmed fish, and other meats) may approach a trillion kilograms per year.

Currently in Canada the average chicken farm produces about 325,000 birds annually.  Because these are averages, we can assume that the output of the largest operations is several times this figure.  In the US, chicken production is dominated by contracting.  Large transnationals such as Tyson Foods contract with individual growers to feed birds.  It is not unusual for a contract grower to have 6 to 12 barns on his or her farm and raise more than a million broiler chickens per year.

We’re probably making too many McNuggets.  We’re probably catching too many fish.  We’re probably feeding too many pigs.  And it is probably not a good idea to double the number of domesticated livestock on the planet—double it to 60 billion animals.  It’s probably time to rethink our food system.  

Graph sources:
FAOSTAT database
OECD-FAO, Agricultural Outlook 2017-2026
Brian Revell: One Man’s Meat … 2050?
Lester Brown: Full Planet, Empty Plates
FAO: World Agriculture Towards 2030/2050, the 2012 revision

Global plastics production, 1917 to 2050

Graph of global plastic production, 1917 to 2017
Global plastic production, megatonnes, 1917 to 2017

This week’s graph shows global annual plastics production over the past 100 years.  No surprise, we see exponential growth—a hallmark of our petro-industrial consumer civilization.  Long-term graphs of nearly anything (nitrogen fertilizer production, energy use, automobile productiongreenhouse gas emissions, air travel, etc.) display this same exponential take-off.

Plastics present a good news / bad news story.  First, we should acknowledge that the production capacities we’ve developed are amazing!  Worldwide, our factories now produce approximately 400 million tonnes of plastic per year.  That’s more than a billion kilograms per day!  Around the world we’ve built thousands of machines that can, collectively, produce plastic soft-drink and water bottles at a rate of nearly 20,000 per second.  Our economic engines are so powerful that we’ve managed to double global plastic production tonnage in less than two decades.

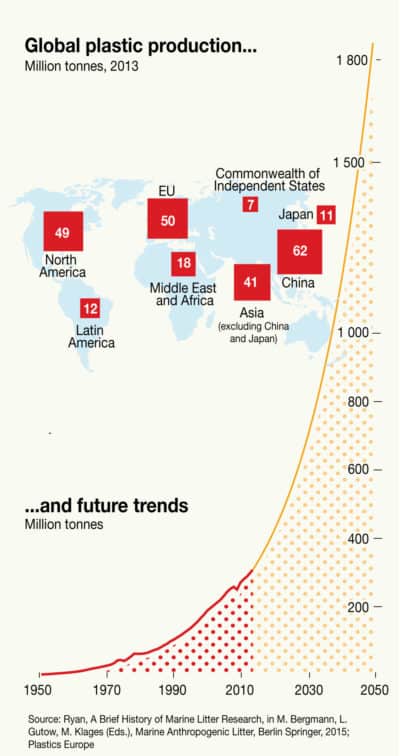
But of course that’s also the bad news: we’ve doubled plastic production tonnage in less than two decades.  And the world’s corporations and governments would have us go on doubling and redoubling plastics production.  The graph below shows the projected four-fold increase in production tonnage by 2050.

Graph of global plastics production to 2050
Projected global plastics production to 2050

Source: UN GRID-Arendal

Plastics are a product of human ingenuity and innovation—one of civilization’s great solutions.  They’re lightweight, durable, airtight, decay resistant, inexpensive, and moldable into a huge range of products.  But projected 2050 levels of production are clearly too much of a good thing.  Our growth-addicted economic system has a knack for turning every solution into a problem—every strength into a weakness.

At current and projected production levels, plastics are a big problem.  Briefly:

1.  Plastics are forever—well, almost.  Except for the tonnage we’ve incinerated, nearly all the plastic ever produced still exists somewhere in the biosphere, although much of it is now invisible to humans, reduced to tiny particles in ocean and land ecosystems.  Plastic is great because it lasts so long and resists decay.  Plastic is a big problem for those same reasons.

2. Only 18 percent of plastic is recycled.  This is the rate for plastics overall, including plastics in cars and buildings.  For plastic packaging (water bottles, chip bags, supermarket packaging, etc.) the recycling rate is just 14 percent.  But much of that plastic inflow is excluded during the sorting and recycling process, such that only 5 percent of plastic packaging material is  actually returned to use through recycling.   And one third of plastic packaging escapes garbage collection systems entirely and is lost directly into the environment: onto roadsides or into streams, lakes, and oceans.

3. Oceans are now receptacles for at least 8 billion kilograms of plastic annually—equivalent to a garbage truck full of plastic unloading into the ocean every minute.  The growth rates projected above will mean that by 2050 the oceans will be receiving the equivalent of one truckload of plastic every 15 second, night and day.  And unless we severely curtail plastic production and dumping, by 2050 the mass of plastic in our oceans will exceed the mass of fish.  Once in the ocean, plastics persist for centuries, in the form of smaller and smaller particles.  This massive contamination comes on top of other human impacts: overfishing, acidification, and ocean temperature increases.

4. Plastic is a fossil fuel product.  Plastic is made from oil and natural gas feedstocks—molecules extracted from the oil and gas become the plastic.  And oil, gas, and other energy sources are used to power the plastic-making processes.  By one estimate, 4 percent of global oil production is consumed as raw materials for plastic and an additional 4 percent provides energy to run plastics factories.

5. Plastics contain additives than harm humans and other species: fire retardants, stabilizers, antibiotics, plasticizers, pigments, bisphenol A, phthalates, etc.  Many such additives mimic hormones or disrupt hormone systems.  The 150 billion kilograms of plastics currently in the oceans includes 23 billion kgs of additives, all of which will eventually be released into those ocean ecosystems.

It’s important to think about plastics, not just because doing so shows us that we’re doing something wrong, but because the tragic story of plastics shows us why and how our production and energy systems go wrong.  The story of plastics reveals the role of exponential growth in turning solutions into problems.  Thinking about the product-flow of plastics (oil well … factory … store … home … landfill/ocean) shows us why it is so critical to adopt closed-loop recycling and highly effective product-stewardship systems.  And the entire plastics debacle illustrates the hidden costs of consumerism, the collateral damage of disposable products, and the failure of “the markets” to protect the planet.

In a recent paper that takes a big-picture, long-term look at plastics, scientists advise that “without a well-designed … management strategy for end-of-life plastics, humans are conducting a singular uncontrolled experiment on a global scale, in which billions of metric tons of material will accumulate across all major terrestrial and aquatic ecosystems on the planet.”

For more analysis of plastics and the flows of other materials, see my recently released book, Civilization Critical: Energy, Food, Nature, and the Future.

Graph sources:
• 1950 to 2015 data from Geyer, Jambeck, and Law, “Production, Use, and Fate of All Plastics Ever Made,” Science Advances 3, no. 7 (July 2017).
• 2016 and 2017 data points are extrapolated at a 4.3 percent growth rate derived from the average growth rate during the previous 20 years.
• Pre-1950 production tonnage is assumed to be negligible, based on various sources and the very low production rates in 1950.

Everything must double: Economic growth to mid-century

Graph of GDP of the world's largest economies, 2016 vs 2050
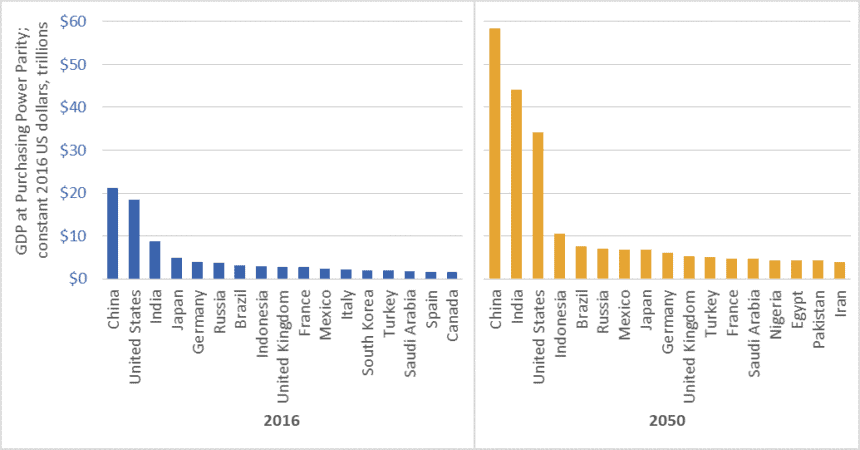
Size of the world’s 17 largest economies, 2016, and projections for 2050

In February 2017, global accounting firm PricewaterhouseCoopers (PwC) released a report on economic growth entitled The Long View: How will the Global Economic Order Change by 2050?  The graph above is based on data from that report.  (link here)  It shows the gross domestic product (GDP) of the largest economies in the world in 2016, and projections for 2050.  The values in the graph are stated in constant (i.e., inflation adjusted) 2016 dollars.

PwC projects that China’s economy in 2050 will be larger than the combined size of the five largest economies today—a list that includes China itself, but also the US, India, Japan, and Germany.

Moreover, the expanded 2050 economies of China and India together ($102.5 trillion in GDP) will be almost as large as today’s global economy ($107 trillion).

We must not, however, simply focus on economic growth “over there.”  The US economy will nearly double in size by 2050, and Americans will continue to enjoy per-capita GDP and consumption levels that are among the highest in the world.  The size of the Canadian economy is similarly projected to nearly double.   The same is true for several EU countries, Australia, and many other “rich” nations.

Everything must double

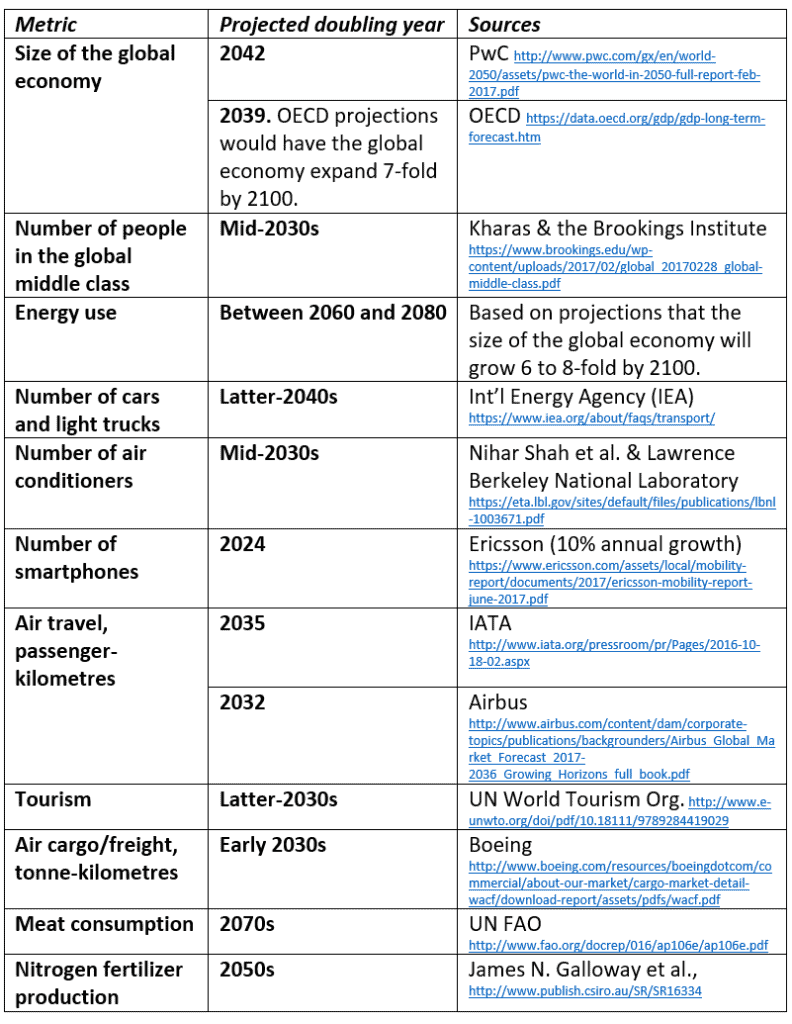
PwC’s report tells us that between now and 2050, the size of the global economy will more than double.  Other reports concur (See the OECD data here).  And this doubling of the size of the global economy is just one metric—just one aspect of the exponential growth around us.  Indeed, between now and the middle decades of this century, nearly everything is projected to double.  This table lists just a few examples.

Table of projected year of doubling for various energy, consumption, transport, and other metrics
Projected year of doubling for selected energy, consumption, and transport metrics

At least one thing, however, is supposed to fall to half

While we seem committed to doubling everything, the nations of the world have also made a commitment to cut greenhouse gas (GHG) emissions by half by the middle decades of this century.  In the lead-up to the 2015 Paris climate talks, Canada, the US, and many other nations committed to cut GHG emissions by 30 percent by 2030.  Nearly every climate scientist who has looked at carbon budgets agrees that we must cut emissions even faster.  To hold temperature increases below 2 degrees Celsius relative to pre-industrial levels, emissions must fall by half by about the 2040s, and to near-zero shortly after.

Is it rational to believe that we can double the number of cars, airline flights, air conditioners, and steak dinners and cut global GHG emissions by half?

To save the planet from climate chaos and to spare our civilization from ruin, we must—at least in the already-rich neighborhoods—end the doubling and redoubling of economic activity and consumption.  Economic growth of the magnitude projected by PwC, the OECD, and nearly every national government will make it impossible to cut emissions, curb temperature increases, and preserve advanced economies and stable societies.  As citizens of democracies, it is our responsibility to make informed, responsible choices.  We must choose policies that curb growth.

Graph source: PriceWaterhouseCoopers

Happy motoring: Global automobile production 1900 to 2016

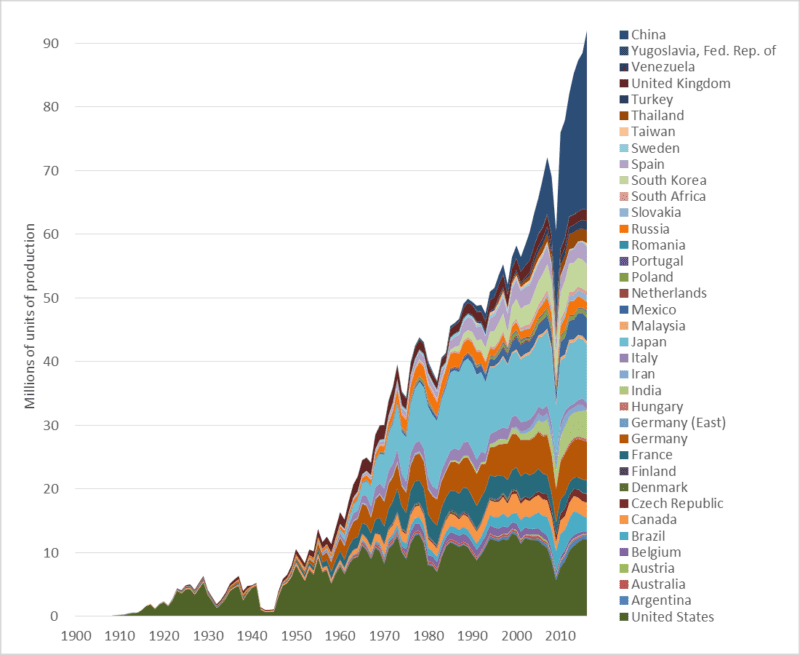
Graph of global automobile production numbers, various nations, historic, 1900 to 2016
Global automobile production (cars, trucks, and buses), 1900-2016

This week’s graph shows global automobile production over the past 116 years—since the industry’s inception.  The numbers include car, trucks, and buses.  The graph speaks for itself.  Nonetheless, a few observations may clarify our situation.

1.  Global automobile production is at a record high, increasing rapidly, and almost certain to rise far higher.

2. Annual production has nearly doubled since 1997—the year the world’s governments signed the Kyoto climate change agreement.

3. China is now the world’s largest automobile producer.  In terms of units made, Chinese production is double that of the United States.  This graph tells us something about the ascendancy of China.

4.  Most of the growth in the auto manufacturing sector is in Asia, especially Thailand, India, and China.  In 2000, those three nations together manufactured 3 million cars.  Last year their output totaled 34 million.  After 67 years of production, Australia is about to shut down its last automobile plant.  Most of its cars will be imported from Thailand, and perhaps a growing number  from China.

5. Auto production in “high-wage countries” is declining.  As noted, the Australian industry has been shuttered.  US production is down 5 percent since 2000, and Canadian production is down 20 percent.  Over that same period, production fell in France, Italy, and Japan, though not in Germany.  Since 2000, auto production increases in Mexico (+1.7 million) are roughly equal to decreases in Canada and the US (-1.2 million).

6. There are some surprises in the data:  Turkey, Slovakia, and Iran all make the  top-20 in terms of production numbers.

Graph sources: Motor Vehicle Manufacturers Association of the United States, World Motor Vehicle Data, 1981 Edition; Ward’s Communications, Ward’s World Motor Vehicle Data 2002; United States Department of Transportation, Bureau of Transportation Statistics, National Transportation Statistics, Table 1-23

Electric cars are coming…  Fast!

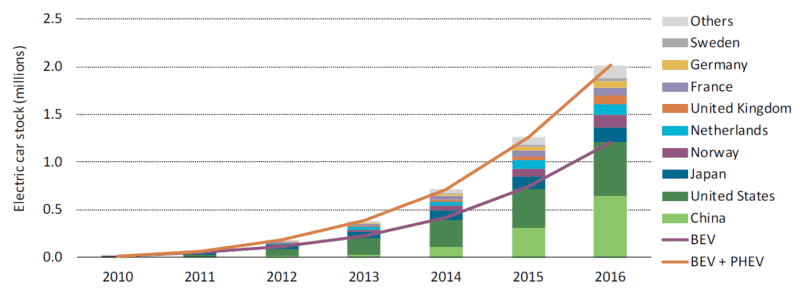
Graph of the number of electric vehicles worldwide and selected nations
Increase in the stock of electric vehicles: global and selected nations

When- and wherever it occurs, exponential growth is transformative.  After a long period of stagnation or slow increase, some important quantity begins doubling and redoubling.  The exponential growth in cloth, coal, and iron production transformed the world during the Industrial Revolution.  The exponential growth in the power and production volumes of transistors (see previous blog post)—a phenomenon codified as “Moore’s Law”—made possible the information revolution, the internet, and smartphones.  Electric cars and their battery systems have now entered a phase of exponential growth.

There are two categories of electric vehicles (EVs).  The first is plug-in hybrid electric vehicles (PHEVs).  These cars have batteries and can be driven a limited distance (usually tens of kilometres) using electrical power only, after which a conventional piston engine engages to charge the batteries or assist in propulsion.  Well-known PHEVs include the Chevrolet Volt and the Toyota Prius Plug-in.

The second category is the battery electric vehicle (BEV).  Compared to PHEVs, BEVs have larger batteries, longer all-electric range (150 to 400 kms), and no internal combustion engines.  Well-known BEVs include the Nissan Leaf, Chevrolet Bolt, and several models from Tesla.  The term electric vehicle (EV) encompasses both PHEVs and BEVs.

The graph above is reproduced from a very recent report from the International Energy Agency (IEA) entitled Global EV Outlook 2017.  It shows that the total number of electric vehicles in the world is increasing exponentially—doubling and redoubling every year or two.  In 2012, there we nearly a quarter-million EVs on streets and roads worldwide.  A year or two later, there were half-a-million.  By 2015 the number had surpassed one million.  And it is now well over two million.  Annual production of EVs is similarly increasing exponentially.  This kind of exponential growth promises to transform the global vehicle fleet.

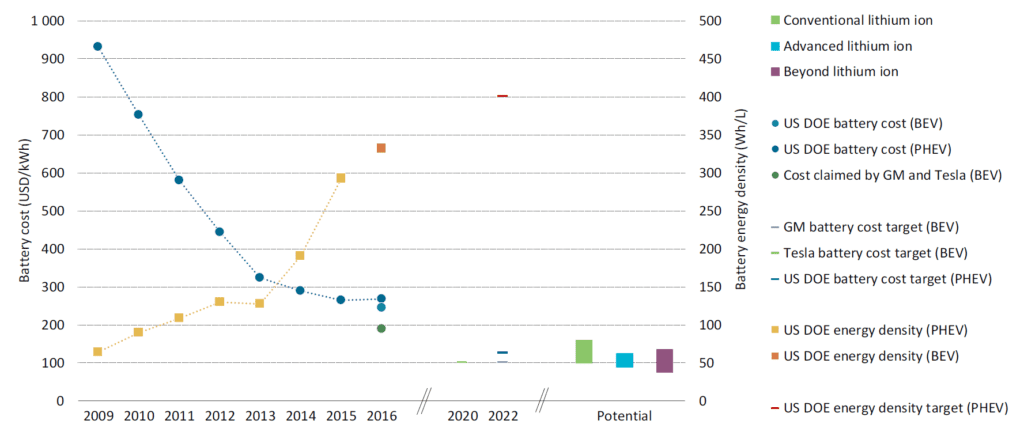
But if it was just vehicle numbers and production volumes that were increasing exponentially this trend would not be very interesting or, in the end, very powerful.  More important, quantitative measures of EV technology and capacity are doubling and redoubling.  This second graph, below, taken from the same IEA report, shows the dramatic decrease in the cost of a unit of battery storage (the downward trending line) and the dramatic increase in the energy storage density of EV batteries (upward trending line).  If we compare 2016 to 2009, we find that today an EV battery of a given capacity costs one-third as much and is potentially one-quarter the size.  Stated another way, for about the same money, and packaged into about the same space, a current battery can drive an electric car three or four times as far.

Graph of electric vehicle battery cost and power density 2009 to 2016

Looking to the future, GM, Tesla, and the US Department of Energy all project that battery costs will decrease by half in the coming five years.  Though these energy density increases and cost decreases will undoubtedly plateau in coming decades, improvements underway now are rapidly moving EVs from the periphery to the mainstream.  EVs may soon eclipse internal-combustion-engine cars in all measures: emissions, purchase affordability, operating costs, performance, comfort, and even sales.

Source for graphs: International Energy Agency, Global EV Outlook 2017: Two Million and Counting