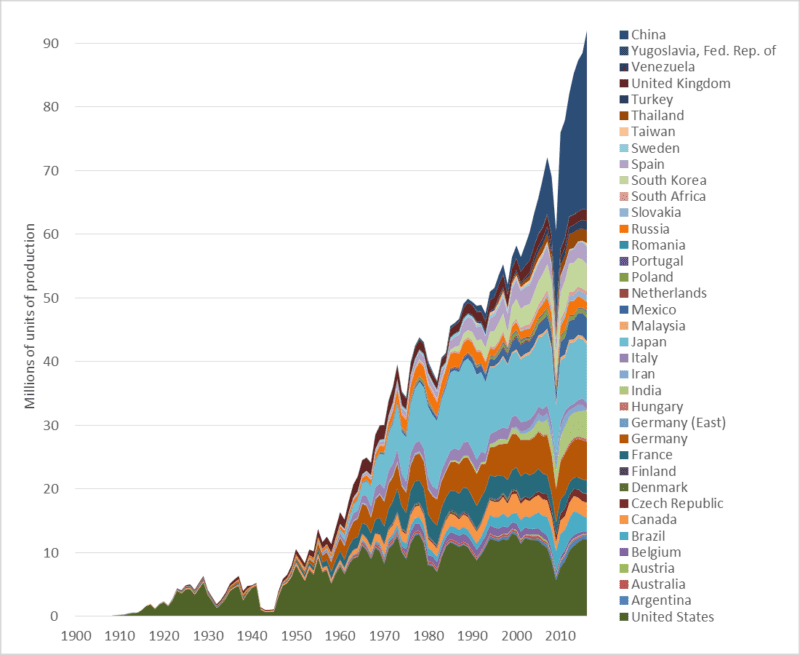
This week’s graph shows global automobile production over the past 116 years—since the industry’s inception. The numbers include car, trucks, and buses. The graph speaks for itself. Nonetheless, a few observations may clarify our situation.
1. Global automobile production is at a record high, increasing rapidly, and almost certain to rise far higher.
2. Annual production has nearly doubled since 1997—the year the world’s governments signed the Kyoto climate change agreement.
3. China is now the world’s largest automobile producer. In terms of units made, Chinese production is double that of the United States. This graph tells us something about the ascendancy of China.
4. Most of the growth in the auto manufacturing sector is in Asia, especially Thailand, India, and China. In 2000, those three nations together manufactured 3 million cars. Last year their output totaled 34 million. After 67 years of production, Australia is about to shut down its last automobile plant. Most of its cars will be imported from Thailand, and perhaps a growing number from China.
5. Auto production in “high-wage countries” is declining. As noted, the Australian industry has been shuttered. US production is down 5 percent since 2000, and Canadian production is down 20 percent. Over that same period, production fell in France, Italy, and Japan, though not in Germany. Since 2000, auto production increases in Mexico (+1.7 million) are roughly equal to decreases in Canada and the US (-1.2 million).
6. There are some surprises in the data: Turkey, Slovakia, and Iran all make the top-20 in terms of production numbers.
Graph sources: Motor Vehicle Manufacturers Association of the United States, World Motor Vehicle Data, 1981 Edition; Ward’s Communications, Ward’s World Motor Vehicle Data 2002; United States Department of Transportation, Bureau of Transportation Statistics, National Transportation Statistics, Table 1-23

