Canucks in hock: 50 years of Canadian debt levels

Graph of Canadian government debt and consumer debt historical
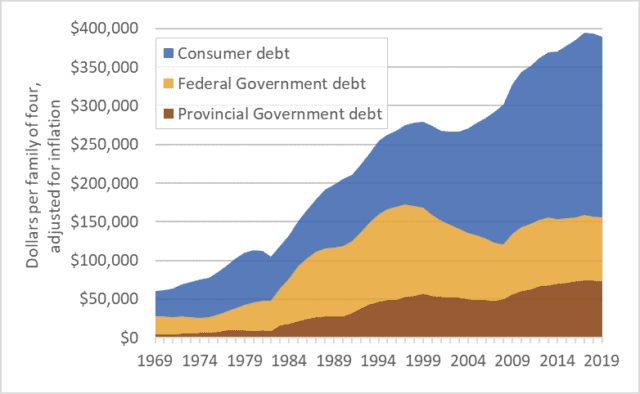
Canadian personal and government debt, per family of four, adjusted for inflation, 1969-2019

Canada has a debt problem.  Total consumer and government debt is now $3.7 trillion, with 60 percent being consumer debt: mortgages, home-equity loans, credit lines, car loans, credit card balances, etc.  Provincial government debt is about $0.7 trillion and federal government debt is $0.8 trillion.  Corporate and financial-system debts would add trillions more, but we’ll leave those amounts aside.

Those are big numbers—too big to make sense of.  It is easier to understand debt if we look at it on a per-household basis.  The graph above shows debt levels for a hypothetical family of four over the past 50 years: 1969 to 2019.  All figures are adjusted for inflation.  For an average Canadian household, debt levels today are about six times higher than in 1970.  Granted, we’re richer than we were in the 1970s, but six times richer?  More important, are we richer as a nation?  In 1970 the eastern oceans were full of cod and western regions were brimming with oil.

There are many ways to evaluate debt—to put it into perspective.  Often it’s expressed as a percentage of GDP or of household income.  The idea being that if the economy is bigger or incomes are larger, it’s okay to owe more.  I want to argue that this is the wrong approach.  I want to suggest a different and more concerning interpretation of ever-rising Canadian debt levels.

Debt rises when our financial outflows exceed inflows.  If we need to pay out more than we are bringing in, we can borrow, and debt goes up.  But implicit in this idea is another one: the day will come when inflows exceed outflows and we’ll have surplus money we can use to pay off the debt.

So let’s look at the graph in that light.  Here’s what the graph shows: collectively, we Canadians couldn’t quite pay all our personal and government bills in the 1970s, so we borrowed money and debt increased.  The same in the 1980s: we didn’t have enough so we borrowed and debt increased.  This continued through the 1990s, 2000s, and 2010s.  In each decade of the past half-century we couldn’t quite afford our lifestyles and infrastructure projects and social programs and day-to-day bills so we borrowed more money than we repaid, so debt rose—continuously, consistently.

So here’s the question that puts this debt into perspective: if we didn’t have enough money in any of the recent decades why are we confident that the situation will change in the future?  Why, after five decades of increasing debt, are we confident that in the 2020s or 2030s or 2040s we can reverse the pattern of two generations and amass money so fast that we’ll not only be able to pay all our personal and government bills but we’ll also have large surpluses we can use to retire the debt we accumulated over 50 years?  …a debt that now stands at about $400,000 per family of four.

Let’s explore that argument again, over a shorter time frame.  Over just the past 15 years—2004 to 2019—the average Canadian household has increased its debt by about 45 percent—by about $110,000.  But the recent decade-and-a-half were good years in much of Canada—unemployment was relatively low, the economy was usually strong, rising stock markets helped stoke investments and retirement accounts.  In many parts of Canada most of the 2004-2019 period was a “boom” time.  The economy was booming, yet we borrowed.  Are we confident that our future will be even more … boomy?  Because it’s in that future that we’re not only going to have to find ways to pay all the day-to-day bills in our households and legislatures, but also find large surpluses to retire debt.  Are we confident that in the 2020s or 2030s our nation and our collective households will be so much richer than we were in the 2004-2019 period that that we’ll be able to retire all that debt?

My aim is certainly not to scold.  Rising debt should not be seen as a personal problem, but rather as a collective error.  Rather, my aim is to warn—to disabuse governments and my fellow citizens of a dangerous and possibly prosperity-curdling idea: that current debt levels are somehow safe and sustainable and that we should be calm as we or our governments pile on trillions more (as the trendlines in the graph suggest we will).  Most of us have debts.  But debt is a public policy issue, not a personal failing.  Moreover, even those who do not have debt should not be smug.  If, as a nation, our collective borrowing rises too far there will be a reckoning, and all will suffer as a result.

Every household must make its own decisions regarding mortgages and education spending and financing cars.  But there is also a larger, collective, public-policy decision needed.  Government leadership is needed to begin moving debt levels lower.

$100 billion and rising: Canadian farm debt

Graph of Canadian farm debt, 1971-2017
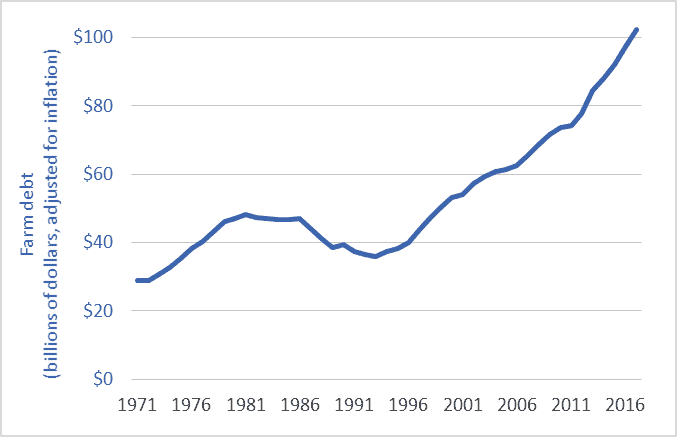
Canadian farm debt, 1971-2017

Canadian farm debt has risen past the $100 billion mark.  According to recently released Statistics Canada data, farm debt in 2017 was $102.3 billion—nearly double the level in 2000.  (All figures and comparisons adjusted for inflation.)

Some analysts and government officials characterize the period since 2007 as “better times” for farmers.  But during that period (2007-2017, inclusive) total farm debt increased by $37 billion—rising by more than $3 billion per year.

Here’s how Canadian agriculture has functioned during the first 18 years of the twenty-first century (2000 to 2017, inclusive):

1. Overall, farmers earned, on average, $47 billion per year in gross revenues from the markets (these are gross receipts from selling crops, livestock, vegetables, honey, maple syrup, and other products).

2. After paying expenses, on average, farmers were left with $1.6 billion per year in realized net farm income from the markets (excluding farm-support program payments).  If that amount was divided equally among Canada’s 193,492 farms, each would get about $8,300.

3. To help make ends meet, Canadian taxpayers transferred to farmers $3.1 billion per year via farm-support-program payments.

4. On top of this, farmers borrowed $2.7 billion per year in additional debt.

5. Farm family members worked at off-farm jobs to earn most of the household income needed to support their families (for data see here and here).

The numbers above give rise to several observations:

A. The amount of money that farmers pay each year in interest to banks and other lenders ($3 billion, on average) is approximately equal to the amount that Canadian citizens each year pay to farmers ($3.1 billion).  Thus, one could say that, in effect, taxpayers are paying farmers’ interest bills.  Governments are facilitating the transfer of tax dollars from Canadian families to farmers and on to banks and their shareholders.

B. Canadian farmers probably could not service their $100 billion dollar debt without government/taxpayer funding.

C. To take a different perspective: each year farmers take on additional debt ($2.7 billion, on average) approximately equal to the amount they are required to pay in interest to banks ($3 billion on average). One could say that for two decades banks have been loaning farmers the money needed to pay the interest on farmers’ tens-of-billions of dollars in farm debt.

Over and above the difficulty in paying the interest, is the difficulty in repaying the principle.  Farm debt now—$102 billion—is equal to approximately 64 years of farmers’ realized net farm income from the markets.  To repay the current debt, Canadian farm families would have to hand over to banks and other lenders every dime of net farm income from the markets from now until 2082.

The Canadian farm sector has many strengths.  By many measures, the sector is extremely successful and productive.  Over the past generation, farmers have managed to nearly double the value of their output and triple the value of agri-food exports.  Output per year, per farmer, and per acre are all up dramatically.  And Canadian farmers lead the world in adopting high-tech production systems.  The problem is not that our farms are backward, inefficient, or unproductive.  Rather, the problems detailed above are the result of voracious wealth extraction by the dominant agribusiness transnationals and banks. (To examine the extent of that wealth extraction, see my blog post here).

Although our farm sector has many strengths and is setting production records, the sector remains in a crisis that began in the mid-1980s.  And what began as a farm income crisis has metastasized into a farm debt crisis.  Further, the sector also faces a generational crisis (the number of farmers under the age of 35 has been cut by half since 2001) and a looming climate crisis.  Policy makers must work with farmers to rapidly restructure and transform Canadian agriculture.  A failure to do so will mean further costs to taxpayers, the destruction of the family farm, and irreparable damage to Canada’s food-production system.

Home grown: 67 years of US and Canadian house size data

Graph of the average size of new single-family homes, Canada and the US, 1950-2017
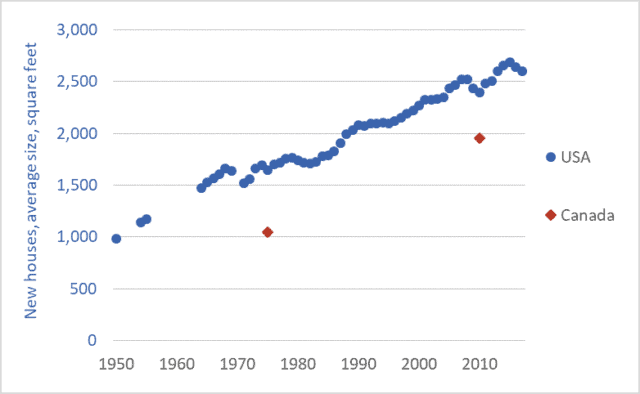
Average size of new single-family homes, Canada and the US, 1950-2017

I was an impressionable young boy back in 1971 when my parents were considering building a new home.  I remember discussions about house size.  1,200 square feet was normal back then.  1,600 square feet, the size of the house they eventually built, was considered extravagant—especially in rural Saskatchewan.  And only doctors and lawyers built houses as large as 2,000 square feet.

So much has changed.

New homes in Canada and the US are big and getting bigger.  The average size of a newly constructed single-family detached home is now 2,600 square feet in the US and probably 2,200 in Canada.  The average size of a new house in the US has doubled since 1960.  Though data is sparse for Canada, it appears that the average size of a new house has doubled since the 1970s.

We like our personal space.  A lot.  Indeed, space per person has been growing even faster than house size.  Because as our houses have been growing, our families have been shrinking, and this means that per-capita space has increased dramatically.  The graph below, from shrinkthatfootprint.com, shows that, along with Australia, Canadians and Americans enjoy the greatest per-capita floorspace in the world.  The average Canadian or American each has double the residential space of the average UK, Spanish, or Italian resident.

Those of us fortunate enough to have houses are living in the biggest houses in the world and the biggest in history.  And our houses continue to get bigger.  This is bad for the environment, and our finances.

Big houses require more energy and materials to construct.  Big houses hold more furniture and stuff—they are integral parts of high-consumption lifestyles.  Big houses contribute to lower population densities and, thus, more sprawl and driving.  And, all things being equal, big houses require more energy to heat and cool.  In Canada and the US we are compounding our errors: making our houses bigger, and making them energy-inefficient.  A 2,600 square foot home with leading edge ‘passiv haus’ construction and net-zero energy requirements is one thing, but a house that size that runs its furnace half the year and its air conditioner the other half is something else.  And multiply that kind of house times millions and we create a ‘built in’ greenhouse gas emissions problem.

Then there are the issues of cost and debt.  We continually hear that houses are unaffordable.  Not surprising if we’re making them twice as large.  What if, over the past decade, we would have made our new houses half as big, but made twice as many?  Might that have reduced prices?

And how are large houses connected to large debt-loads?  Canadian debt now stands at a record $1.8 trillion.  Much of that is mortgage debt.  Even at low interest rates of 3.5 percent, the interest on that debt is $7,000 per year for a hypothetical family of four.  And that’s just the average.  Many families are paying a multiple of that amount, just in interest.  Then on top of that there are principle payments.  It’s not hard to see why so many families struggle to save for retirement or pay off debt.

Our ever-larger houses are filling the air with emissions; emptying our pockets of saving; filling up with consumer-economy clutter; and creating car-mandatory unwalkable, unbikable, unlovely neighborhoods.

The solutions are several fold.  First, new houses must stop getting bigger.  And they must start getting smaller.  There is no reason that Canadian and US residential spaces must be twice as large, per person, as European homes.  Second, building standards must get a lot better, fast.  Greenhouse gas emissions must fall by 50 to 80 percent by mid-century.  It is critical that the houses we build in 2020 are designed with energy efficient walls, solar-heat harvesting glass, and engineered summer shading such that they require 50 to 80 percent less energy to heat and cool.  Third, we need to take advantage of smaller, more rational houses to build more compact, walkable, bikable, enjoyable neighborhoods.  Preventing sprawl starts at home.

Finally, we need to consider questions of equity, justice, and compassion.  What is our ethical position if we are, on the one hand, doubling the size of our houses and tripling our per-capita living space and, on the other hand, claiming that we “can’t afford” housing for the homeless.  Income inequality is not just a matter of abstract dollars.  This inequality is manifest when some of us have rooms in our homes we seldom visit while others sleep outside in the cold.

We often hear about the “triple bottom line”: making our societies ecologically, economically, and socially sustainable.  Building oversized homes moves us away from sustainability, on all three fronts.

Graph sources:
US Department of Commerce/US Census Bureau, “2016 Characteristics of New Housing”
US Department of Commerce/US Census Bureau, “Characteristics of New Housing: Construction Reports”
US Department of Commerce/US Census Bureau, “Construction Reports: Characteristics of New One-Family Homes: 1969”
US Department of Labour, Bureau of Labour Statistics, “New Housing and its Materials:1940-56”
Preet Bannerjee, “Our Love Affair with Home Ownership Might Be Doomed,” Globe and Mail, January 18, 2012 (updated February 20, 2018) 

$20 TRILLION: US national debt, and stealing from the future

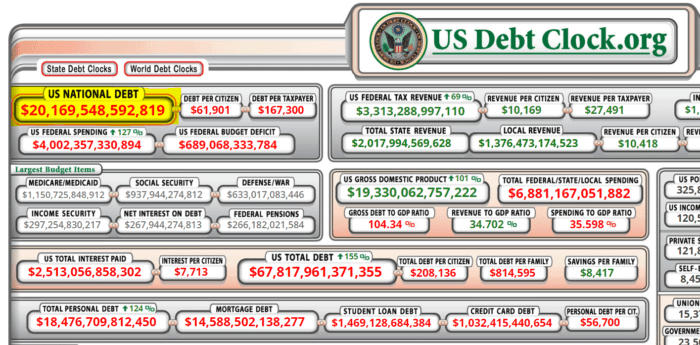
Debt clock showing that the US national debt has topped $20 trillion

Bang!  Last week, US national debt broke through the $20 trillion mark.  As I noted in a previous post (link here), debt of this magnitude works out to about $250,000 per hypothetical family of four.

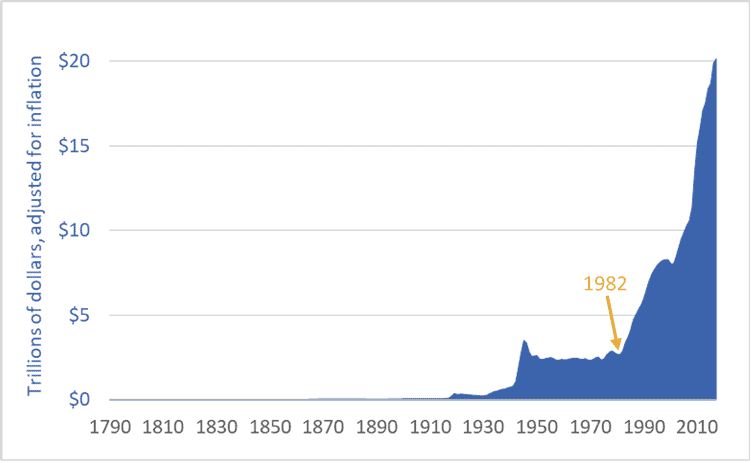
Moreover, US national debt is rising faster than at any time in history.  Adjusted for inflation, the debt is seven times higher than in 1982 ($20 trillion vs. $2.9 trillion).  Indeed, it was in 1982—not 2001 or 2008—that US government debt began its unprecedented (and probably disastrous) rise.

The graph below shows US debt over the past 227 years.  The figures are adjusted for inflation (i.e., they are stated in 2017 US dollars).

Graph of US national debt, historic, 1790 to 2017
United States national debt, adjusted for inflation, 1790-2017

It’s important to understand what is happening here: the US is transferring wealth from the future into the present.  The United States government is not merely engaging in some Keynesian fiscal stimulus, it is not simply borrowing for a rainy day (or 35 years of rainy days), it is not just taking advantage of low interest rates to do a bit of infrastructural fix-up or job creation, and it is not just responding to the financial crisis of 2008.  No.  The US government, the nation’s elites, its corporations, and its citizens are engaging in a form of temporal imperialism—colonizing the future and plundering its wealth.  They are today spending wealth that, if this debt is ever to be repaid, will have to be created by workers toiling in decades to come.

You cannot understand our modern world unless you understand this: Fossil-fueled consumer-industrial economies such as those in the US, Canada, and the EU draw heavily from the future and the past.

We reach back in time hundreds-of-millions of years to source the fossil fuels to power our cars and cities.  We are increasingly reliant on hundred-million-year-old sunlight to feed ourselves—accessing that ancient sunshine in the form of natural gas we turn into nitrogen fertilizer and enlarged harvests.  At the same time, we irrigate many fields from fossil aquifers, created at the end of the last ice age and now pumped hundreds of times faster than they refill.  We extract metal ores concentrated in the distant past.  And the cement in the concrete that forms our cities is the calcium-rich remnants of tiny sea creatures that lived millions of years ago.  We have thrust the resource-intake pipes for our food, industrial, and transport systems hundreds-of-millions of years into the past.

We also reach forward in time, consuming the wealth of future generations as we borrow and spend trillions of dollars they must repay; live well in the present at the expense of their future climate stability; deplete resources, clear-cut ecosystems, extinguish species, and degrade soils and water supplies.  We consume today and push the bills into the future.  This is the real meaning of the news that US national debt has now topped $20 trillion.

Graph sources: U.S. Department of the Treasury, “TreasuryDirect: Historical Debt Outstanding–Annual”  (link here

Improvident province: Saskatchewan government debt

Total Saskatchewan provincial government debt, 1977 to 2017

   ‘Improvident’: Lacking foresight; spendthrift; failing to provide for the future.  

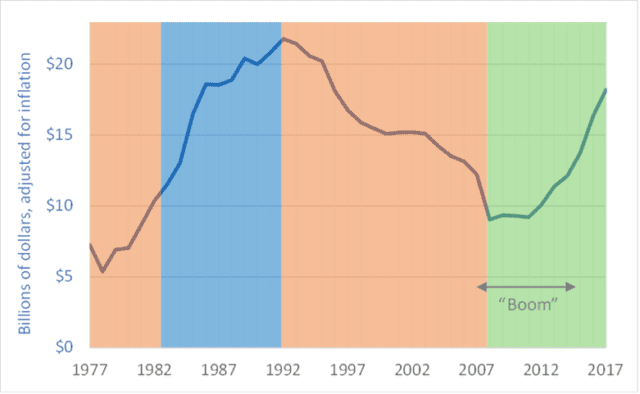
This week’s graph shows total Saskatchewan government debt, adjusted for inflation, for the period 1977 to 2017.  The coloured shading indicates the political party in power at the time: orange for New Democratic Party, blue for the Conservative Party, and green for the Saskatchewan Party.

From 2007 to 2015, Saskatchewan experienced an economic boom.  In 2007 and ’08, commodity values spiked and pushed up the prices of potash, uranium, oil, natural gas, lumber, and grains and oilseeds.  Provincial gross domestic product (GDP) rose sharply.  Even after the financial problems of 2008, a revival in energy prices and energy-sector expansion in this province and neighboring Alberta kept demand for employees strong and wages high (for many workers, though not all).  Since the boom began, housing prices in Saskatchewan have nearly doubled.  Saskatchewan went from being a have-not province to a prosperous and swaggering economic leader.

As resource royalties rose and taxable incomes and sales increased, provincial tax inflows initially swelled.  One could imagine that the provincial government would take advantage of these windfalls to pay down Saskatchewan’s debt.  The government did not.  Instead, it cut taxes and embarked on several ill-conceived spending projects.  Corporate income taxes in Saskatchewan are now, according to the government, the lowest in the country (source here).  As the graph shows, after 16 years of paying down the debt (1992-2008), that pay-down ended in 2009, just as the Saskatchewan economy was heating up.

Initially, provincial debt levels stayed relatively constant as the boom proceeded, but debt began increasing in 2012.  Since then, Saskatchewan’s provincial government debt has doubled, with much of the increase racked up before the economic good times ended. Even as the economy was prospering the government was borrowing money.

Having squandered its chance to pay down debt, save for a rainy day, or build up a financial cushion, the Saskatchewan government came to the end of the economic upturn only to find itself in an increasingly dire financial situation.  In its most recent budget, the province took several draconian steps to try to control its self-inflicted deficits and restrain its ballooning debt.  The government:
– shut down the province’s bus company;
– cut transfers to cities;
– reduced funding to libraries;
– eliminated funding for home repairs for people on social assistance;
– reduced wages for civil servants;
– cut subsidized podiatry services (creating a risk of increased foot amputations for diabetics and others);
– cut subsidies for hearing aids for children; and
– eliminated funding to pay for funerals for its poorest citizens.

Projections by the provincial government show that by 2020 the province’s debt will return to levels not seen since 1992.  In that year, provincial government cabinet ministers were forced to fly to New York City to meet with bond-rating agencies to prevent those agencies from downgrading provincial debt to “junk” status.  The specter of a return to those levels of debt shows that the government of Saskatchewan truly bungled the boom.

Graph sources: data obtained by request from the Economic & Fiscal Policy Branch of Saskatchewan’s Ministry of Finance

Agribusiness takes all: 90 years of Canadian net farm income

Graph of Canadian net farm income and gross revenues, 1926 to 2016
Canadian net farm income and gross revenue, inflation adjusted, net of government payments, 1926–2016.

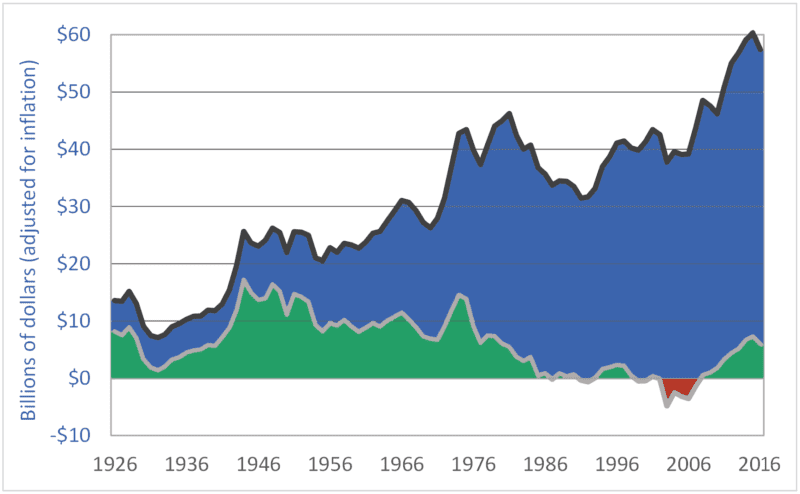
Canadian net farm income remains low, despite a modest recovery during the past decade.  In the graph above, the black, upper line is gross farm revenue.  The lower, gray line is realized net farm income.  Both measures are adjusted for inflation.  And, in both cases, taxpayer-funded farm support payments are subtracted out, to remove the masking effects these payments can otherwise create.  The graph shows farmers’ revenues and net incomes from the markets.

The green-shaded area highlights periods of positive net farm income; the red-shaded area marks negative net income periods.  Most important, however, is the area shaded blue—the area between the gross revenue and net income lines.  That area represents farmers’ expenses: the amounts they pay to input manufacturers (Monsanto, Agrium, Deere, Shell, etc.) and service providers (banks, accountants, etc.).  Note how the blue area has expanded over time to consume almost all of farmers’ revenues, forcing Canadian net farm income lower and lower.

In the 23 years from 1985 to 2007, inclusive, the dominant agribusiness input suppliers and service providers captured 100 percent of Canadian farm revenues—100 percent!  During that period, all of farm families’ household incomes had to come from off-farm employment, taxpayer-funded farm-support programs, asset sales and depreciation, and borrowed money.  During that time, farmers produced and sold $870 billion worth of farm products, but expenses (i.e., amounts captured by input manufacturers and service providers) consumed the entire amount.

Bringing these calculations up to date, in the 32-year period from 1985 to 2016, inclusive, agribusiness corporations captured 98 percent of farmers’ revenues—$1.32 trillion out of $1.35 trillion in revenues.  These globally dominant transnational corporations have made themselves the primary beneficiaries of the vast food wealth produced on Canadian farms.  These companies have extracted almost all the value in the “value chain.”  They have left Canadian taxpayers to backfill farm incomes (approximately $100 billion have been transferred to farmers since 1985).  And they have left farmers to borrow the rest (farm debt is at a record high–just under $100 billion).  The massive extraction of wealth by some of the world’s most powerful corporations is the cause of an ongoing farm income crisis.

To leave a comment, click on the graph or this post’s title and then scroll down.

Graph sources: Statistics Canada, CANSIM matrices, and Statistics Canada, Agricultural Economic Statistics, Catalogue No.  21-603-XPE

Deep into the red: US national debt per family, 1816 to 2016

US national debt graph 1816 to 2016, dollars per family
United States national debt, per family of four, 1816-2016

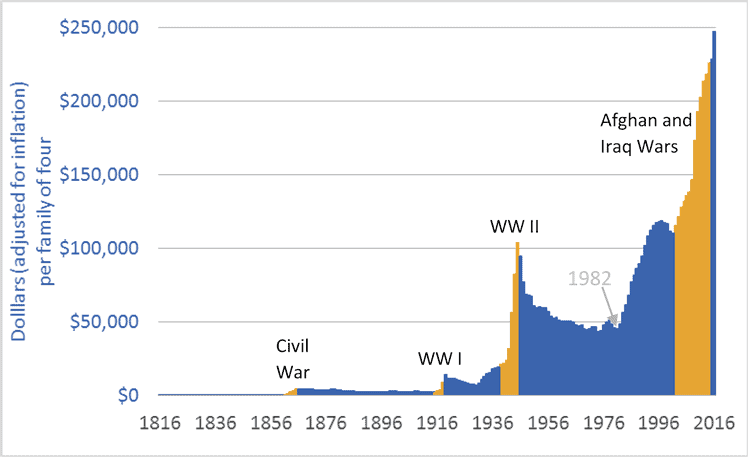
In the United States, federal government debt is nearly $20 trillion. That works out to about $62,000 per person, or just under $250,000 for a hypothetical family of four. Adjusted for inflation, debt has doubled since 2002, and is five times higher than in 1982.

The graph above shows the increasing size of the US national debt. The time-frame is 1816 to 2016. The units are US dollars, adjusted for inflation. In the graph, some conflict periods are highlighted in a contrasting colour. Wars have caused rapid increases in government debt. Indeed, the wars in Iraq and Afghanistan (2002-2014) played significant roles in creating the unprecedented level of debt US families now must carry. Other factors include a financial meltdown and bailout, and tax cuts that eroded revenues and forced governments to fund a greater portion of their services with borrowed money. As visible in the graph, 1982 marks the beginning of the recent phase of debt expansion. That is also the beginning of the modern era of tax cutting—the implementation of the Reagan tax cuts. US citizens have enjoyed tax cuts, but have yet to pay for them.

The graph shows that periods of increasing national debt (the Civil War, WW I, and WW II) were followed by periods of declining debt. The question now is this: Does the US economy retain enough vigour, and do US citizens and businesses retain enough good sense and discipline, to pay down $20 trillion in federal government debt, trillions more in personal debt, and trillions more in city, county, and state debts? It is never wise to bet against America. But de-industrialization, rising income inequality, world-leading incarceration rates, uncontrolled gun crime, Detroit and similar rustbelt cities, legislative gridlock, crumbling infrastructure, and a retreat into ideology all raise serious concerns.

For comparison, Canadian national debt works out to about $80,000 (Cdn.) per hypothetical family of four. Canadians, however, must not feel in any way superior or safe, because the Canadian and US economies are so tightly tied. Rising US debt is a concern for all the world’s citizens.

Graph sources: U.S. Department of the Treasury, “TreasuryDirect: Historical Debt Outstanding–Annual”