The nitrogen crisis: the other mega-threat to the biosphere

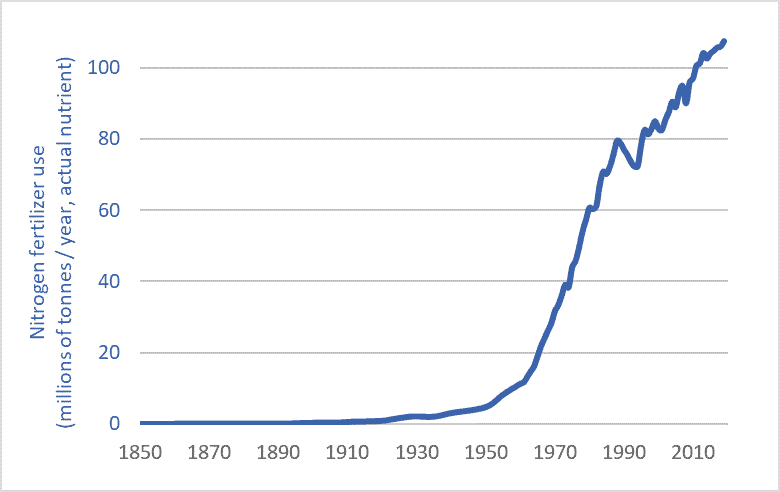
Nitrogen fertilizer use graph historic long-term 1850-2019
Global nitrogen fertilizer use, 1850-2019

If there was no climate crisis we’d all be talking about the nitrogen crisis.  Humans have super-saturated Earth’s biosphere with reactive nitrogen, setting off a cascade of impacts from species shifts, ecosystem changes, and extinctions to ocean dead zones and algae-clogged lakes.  When scientists surveyed the many threats to the biosphere to determine a “safe operating space” for planet Earth, the areas in which they concluded that we’d pushed furthest past “planetary boundaries” were climate change, species extinction, and nitrogen flows.  The graphic below, from the journal Nature, shows the extent to which we’ve transgressed safe planetary boundaries.  Note nitrogen—the red wedge, lower right.
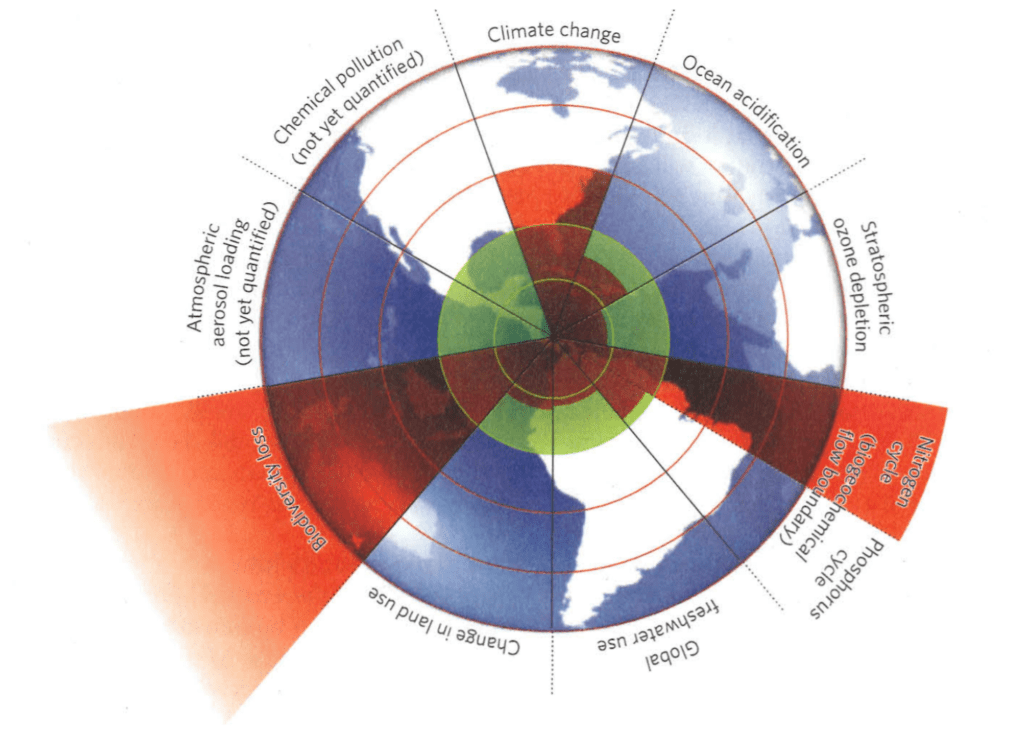
Planetary Boundaries Rockstrom Steffen et al

Source: Reproduced from: Johan Rockström, Will Steffen, et al., “A Safe Operating Space for Humanity,” Nature 461, no. 24 (2009).

A nitrogen primer

Nitrogen is indispensable for life—a building block of proteins and DNA.  Nitrogen (N) is one of the most important plant nutrients and the most heavily applied agricultural fertilizer.  Nitrogen  is common in the atmosphere—making up 78 percent of the air we breath.  But this atmospheric N is inert; non-reactive—it can’t be used by plants.  In contrast, reactive, plant-usable N is just one-one-thousandth as abundant in the biosphere as nitrogen gas is in the atmosphere.  For hundreds-of-millions of years, plants have struggled to find sufficient quantities of usable N.

But humans have intervened massively in the planet’s nitrogen cycles—effectively tripling the quantity of N flowing through terrestrial ecosystems—through farmland, forests, wetlands, and grasslands.  In intensively cropped areas, nitrogen flows are now ten times higher than natural levels.

Here’s the most important part: nitrogen is a fossil-fuel product.  Natural gas is the main input for making N fertilizer.  That gas provides the tremendous energy, heat, and pressure needed to split atmospheric nitrogen molecules and combine N atoms with hydrogen to make reactive compounds.  The amount of energy needed to create, transport, and apply one tonne of N fertilizer is nearly equal to two tonnes of gasoline.  Nitrogen is one way that we push fossil-fuel energy into the food system in order to push more food out.  We turn fossil fuels into fertilizer into food into us.

Humans managed to increase global food production about eight-fold during the 20th and early 21st centuries.*  There’s more tonnage coming out of our food system.  But that system is linear, so if there’s more food coming out one end, there must be more inputs being pushed into the other end—more energy, chemicals, and fertilizers.  The graph above shows how humans have increased N fertilizer inputs three-hundred-fold since 1900 and thereby helped increase human food outputs eight-fold, and human populations four-and-a-half-fold.  By pushing in a hundred million tonnes of fossil-fuel-derived fertilizer we can push out enough food to feed an additional six billion people.  (for more information on nitrogen, see chapters 3 and 28 of my recent book, Civilization Critical.)

Greenhouse gas emission from nitrogen fertilizer

The nitrogen crisis is compounded by the fact that N production and use drive climate change.  The production and use of nitrogen fertilizer is unique among human activities in that it produces large quantities of all three of the main greenhouse gases: carbon dioxide (from fertilizer-production facilities fueled by natural gas); nitrous oxide (from soils over-enriched by factory-made N); and methane (from the production and distribution of natural gas feedstocks and from the fertilizer-production process, i.e., from fracking, leaking gas pipelines, and from emissions from fertilizer plants).  A 2019 science journal article reported that actual methane emissions from fertilizer plants may be 100 times higher than previously assumed.  Emissions from N fertilizer production and use make up about half the total emissions from agriculture in many regions.  It’s fertilizer, not diesel fuel, that’s the largest emissions source on many farms.

Alternatives

We cannot continue to push massive quantities of petro-industrial N fertilizer into our farm fields and ecosystems.   Luckily there are alternatives and partial solutions.  these include:
– Getting nitrogen from natural sources: legumes and better crop rotations;
– Scaling back our demand for agricultural products: reducing food waste; rethinking biofuels; minimizing nutritionally disfigured food (sugar pops and tater tots); ceasing the attempt to globally proliferate North American levels of meat consumption;
– Funding agronomic research into low-input, organic, and agro-ecological production systems;  and
– Rationalizing and democratizing our food system—moving away from systems based on yield-, output-, trade-, and profit-maximization; corporate control; farmer elimination; and energy- and emission-maximization to new paradigms based on food sovereignty, health and nutrition-maximization, input-optimization, emissions-reduction, and long-term sustainability.

Any maximum-input, maximum-output agricultural system will  be a high-emission system.  Input reduction, however, can boost sustainability and net farm incomes while reducing energy use and emissions.  Cutting N use is key.

* The FAO records a four-fold increase in grain production between 1950 and 2018 and it is likely that production roughly doubled between 1900 and 1950, so an eight- to ten-fold increase in production is likely between 1900 and 2018.

Graph sources:
International Fertilizer Association (IFA);
– Vaclav Smil, Enriching the Earth (Cambridge, MA: The MIT Press, 2001);
– UN Food and Agriculture Organization (FAO), FAOSTAT; and
– Clark Gellings & Kelly Parmenter, “Energy Efficiency in Fertilizer Production and Use.”

 

Another trillion tonnes: 250 years of global material use data

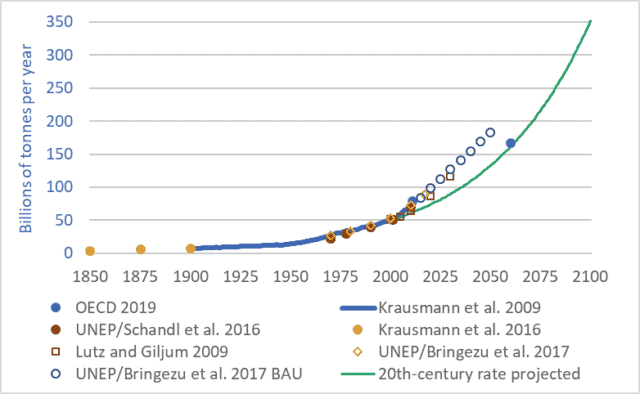
Graph of Global materials use 1850-2100
Global materials use, 1850-2100

Want to understand your society and economy and the fate of petro-industrial civilization?  If so, don’t “follow the money.”  The stock market casino, quantitative easing, derivatives and other “financial innovations,” and the trillions of e-dollars that flit through the global monetary system each day obscure the real economy—the production and destruction of actual wealth: mining, farming, processing, transport, manufacturing, consumption, disposal.  To understand where we are and where we may be going, we must follow more tangible flows—things that are real.  We must follow the oil, coal, steel, concrete, grain, copper, fertilizers, salt, gravel, and other materials.

Our cars, homes, phones, foods, fuels, clothes, and all the other products we consume or aspire to are made out of stuff—out of materials, out of wood, iron, cotton, etc.   And our economies consume enormous quantities of those materials—tens-of-billions of tonnes per year.

The graph above shows 250 years of actual and projected material flows through our global economy.  The graph may initially appear complicated, because it brings together seven different sources and datasets and includes a projection to the year 2100.  But the details of the graph aren’t important.  What is important is the overall shape: the ever-steepening upward trendline—the exponential growth.

In 1900, global material flows totalled approximately 7 billion tonnes.  The technical term for these material flows is “utilized materials”—the stuff we dig out of mines, pump up from oil or natural gas wells, cut down in forests, grow on farms, catch from the sea, dig out of quarries, and otherwise appropriate for human uses.  These tonnages do not include water, nor do they include unused overburden, but they do include mine tailings, though this last category adds just a few percent to the total.

Between 1900 and 2000, global material tonnage increased sevenfold—to approximately 49 billion tonnes (Krausman et al. 2009).  Tonnage rose to approx. 70 billion tonnes by 2010 (UNEP/Schandl 2016), and to approx. 90 billion tonnes by 2018 (UNEP/Bringezu 2018).  At the heart of our petro-industrial consumerist civilization is a network of globe-spanning conveyors that, each second, extract and propel nearly 3,000 tonnes of materials from Earth’s surface and subsurface to factories, cities, shops, and homes, and eventually on to landfills, rivers and oceans, and the atmosphere.  At a rate of a quarter-billion tonnes per day we’re turning the Earth and biosphere into cities, homes, products, indulgences, and fleeting satisfactions; and emissions, by-products, toxins, and garbage.

And these extraction, consumption, and disposal rates are projected to continue rising—to double every 30 to 40 years (Lutz and Giljum 2009).  Just as we increased material use sevenfold during the 20th century we’re on track to multiply it sevenfold during the 21st.  If we maintain the “normal” economic growth rates of the 20th century through the 21st we will almost certainly increase the volume and mass of our extraction, production, and disposal sevenfold by 2100.

But 2100 is a long way away.  Anything could happen by then.  Granted.  So let’s leave aside the long-term and look only at the coming decade.  Material throughput now totals about 90 billion tonnes per year, and is projected to rise to about 120 billion tonnes per year over the coming decade.  For ease of math, let’s say that the average over the coming decade will be 100 billion tonnes per year.  That means that between 2019 and 2029 we will extract from within the Earth and from the biosphere one trillion tonnes of materials: coal, oil, wood, fish, nickel, aluminum, chromium, uranium, etc.  …one trillion tonnes.  And we’ll send most of that trillion tonnes on into disposal in the ground, air, or water—into landfills, skyfills, and seafills.  In the coming decade, when you hear ever-more-frequent reports of the oceans filling with plastic and the atmosphere filling with carbon, think of that trillion tonnes.

Postscript: “dematerialization”

At conferences and in the media there’s a lot of talk of “dematerialization,” and its cousin “decarbonization.”  The idea is this: creating a dollar of economic activity used to require X units of energy or materials, but now, in countries such as Canada and the United States, creating a dollar of economic activity requires only two-thirds-X units.  Pundits and officials would have us believe that, because efficiency is increasing and less material and energy are needed per dollar, the economy is being “dematerialized.”  They attempt to show that the economy can grow and grow but we need not use more materials or energy.  Instead of consuming heavy steel cars, we will consume apps, massages, and manicures.  But this argument is wrong.  Global material and energy use increased manyfold during the 20th century.  The increases continue.  A business-as-usual scenario will see energy and materials use double every 30 to 40 years.  And just because the sizes of our economies, measured in abstract currencies, are growing faster, this does not change the fact that our use of energy and materials is growing.  “Dematerialization” has no useful meaning in a global economy in which we are using 90 billion tonnes of materials per year and projecting the use of 180 billion tonnes by 2050.  Our rate of extraction and consumption of materials is rising; the fact that the volume of dollar flows is rising faster is merely a distraction.

Sources for material flow tonnage:

Fridolin Krausmann et al., “Growth in Global Materials Use, GDP, and Population During the 20th Century,” Ecological Economics 68, no. 10 (2009).

Christian Lutz and Stefan Giljum, “Global Resource Use in a Business-as-Usual World: Updated Results from the GINFORS Model,” in Sustainable Growth and Resource Productivity: Economic and Global Policy Issues, ed. Bleischwitz et al. (Sheffield, UK: Greenleaf Publishing, 2009).

Stefan Giljum et al., Sustainable Europe Research Institute (SERI), “Resource Efficiency for Sustainable Growth: Global Trends and European Policy Scenarios,” background paper, delivered Sept. 10, 2009, in Manila, Philippines.

Julia Steinberger et al., “Global Patterns of Materials Use: A Socioeconomic and Geophysical Analysis,” Ecological Economics 69, no. 5 (2010).

UN Environmental Programme (UNEP) and H. Schandl et al., Global Material Flows and Resource Productivity: An Assessment Study of the UNEP International Resource Panel (Paris: UNEP, 2016).

Krausmann et al., “Long-term Trends in Global Material and Energy Use,” in Social Ecology: Society-Nature Relations across Time and Space, ed. Haberl et al. (Switzerland: Springer, 2016).

United Nations Environment Programme (UNEP), International Resource Panel, and Stefan Bringezu et al., Assessing Global Resource Use: A Systems Approach to Resource Efficiency and Pollution Reduction (Nairobi: UNEP, 2017).

Organization for Economic Cooperation and Development (OECD), Global Material Resources Outlook to 2060: Economic Drivers and Environmental Consequences (Paris: OECD Publishing, 2019)

Global plastics production, 1917 to 2050

Graph of global plastic production, 1917 to 2017
Global plastic production, megatonnes, 1917 to 2017

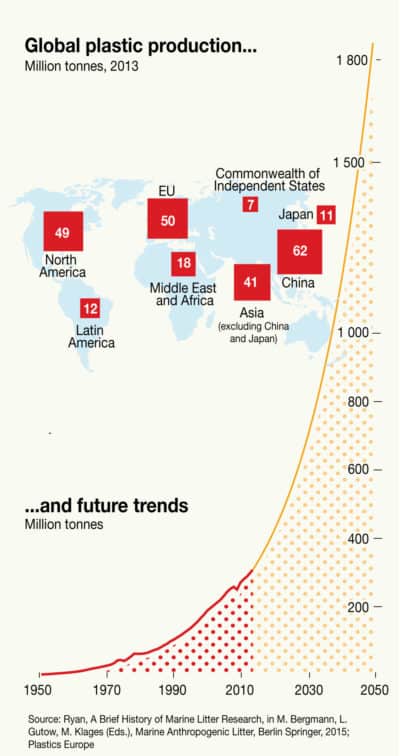
This week’s graph shows global annual plastics production over the past 100 years.  No surprise, we see exponential growth—a hallmark of our petro-industrial consumer civilization.  Long-term graphs of nearly anything (nitrogen fertilizer production, energy use, automobile productiongreenhouse gas emissions, air travel, etc.) display this same exponential take-off.

Plastics present a good news / bad news story.  First, we should acknowledge that the production capacities we’ve developed are amazing!  Worldwide, our factories now produce approximately 400 million tonnes of plastic per year.  That’s more than a billion kilograms per day!  Around the world we’ve built thousands of machines that can, collectively, produce plastic soft-drink and water bottles at a rate of nearly 20,000 per second.  Our economic engines are so powerful that we’ve managed to double global plastic production tonnage in less than two decades.

But of course that’s also the bad news: we’ve doubled plastic production tonnage in less than two decades.  And the world’s corporations and governments would have us go on doubling and redoubling plastics production.  The graph below shows the projected four-fold increase in production tonnage by 2050.

Graph of global plastics production to 2050
Projected global plastics production to 2050

Source: UN GRID-Arendal

Plastics are a product of human ingenuity and innovation—one of civilization’s great solutions.  They’re lightweight, durable, airtight, decay resistant, inexpensive, and moldable into a huge range of products.  But projected 2050 levels of production are clearly too much of a good thing.  Our growth-addicted economic system has a knack for turning every solution into a problem—every strength into a weakness.

At current and projected production levels, plastics are a big problem.  Briefly:

1.  Plastics are forever—well, almost.  Except for the tonnage we’ve incinerated, nearly all the plastic ever produced still exists somewhere in the biosphere, although much of it is now invisible to humans, reduced to tiny particles in ocean and land ecosystems.  Plastic is great because it lasts so long and resists decay.  Plastic is a big problem for those same reasons.

2. Only 18 percent of plastic is recycled.  This is the rate for plastics overall, including plastics in cars and buildings.  For plastic packaging (water bottles, chip bags, supermarket packaging, etc.) the recycling rate is just 14 percent.  But much of that plastic inflow is excluded during the sorting and recycling process, such that only 5 percent of plastic packaging material is  actually returned to use through recycling.   And one third of plastic packaging escapes garbage collection systems entirely and is lost directly into the environment: onto roadsides or into streams, lakes, and oceans.

3. Oceans are now receptacles for at least 8 billion kilograms of plastic annually—equivalent to a garbage truck full of plastic unloading into the ocean every minute.  The growth rates projected above will mean that by 2050 the oceans will be receiving the equivalent of one truckload of plastic every 15 second, night and day.  And unless we severely curtail plastic production and dumping, by 2050 the mass of plastic in our oceans will exceed the mass of fish.  Once in the ocean, plastics persist for centuries, in the form of smaller and smaller particles.  This massive contamination comes on top of other human impacts: overfishing, acidification, and ocean temperature increases.

4. Plastic is a fossil fuel product.  Plastic is made from oil and natural gas feedstocks—molecules extracted from the oil and gas become the plastic.  And oil, gas, and other energy sources are used to power the plastic-making processes.  By one estimate, 4 percent of global oil production is consumed as raw materials for plastic and an additional 4 percent provides energy to run plastics factories.

5. Plastics contain additives than harm humans and other species: fire retardants, stabilizers, antibiotics, plasticizers, pigments, bisphenol A, phthalates, etc.  Many such additives mimic hormones or disrupt hormone systems.  The 150 billion kilograms of plastics currently in the oceans includes 23 billion kgs of additives, all of which will eventually be released into those ocean ecosystems.

It’s important to think about plastics, not just because doing so shows us that we’re doing something wrong, but because the tragic story of plastics shows us why and how our production and energy systems go wrong.  The story of plastics reveals the role of exponential growth in turning solutions into problems.  Thinking about the product-flow of plastics (oil well … factory … store … home … landfill/ocean) shows us why it is so critical to adopt closed-loop recycling and highly effective product-stewardship systems.  And the entire plastics debacle illustrates the hidden costs of consumerism, the collateral damage of disposable products, and the failure of “the markets” to protect the planet.

In a recent paper that takes a big-picture, long-term look at plastics, scientists advise that “without a well-designed … management strategy for end-of-life plastics, humans are conducting a singular uncontrolled experiment on a global scale, in which billions of metric tons of material will accumulate across all major terrestrial and aquatic ecosystems on the planet.”

For more analysis of plastics and the flows of other materials, see my recently released book, Civilization Critical: Energy, Food, Nature, and the Future.

Graph sources:
• 1950 to 2015 data from Geyer, Jambeck, and Law, “Production, Use, and Fate of All Plastics Ever Made,” Science Advances 3, no. 7 (July 2017).
• 2016 and 2017 data points are extrapolated at a 4.3 percent growth rate derived from the average growth rate during the previous 20 years.
• Pre-1950 production tonnage is assumed to be negligible, based on various sources and the very low production rates in 1950.

Full-world economics and the destructive power of capital: Codfish catch data 1850 to 2000

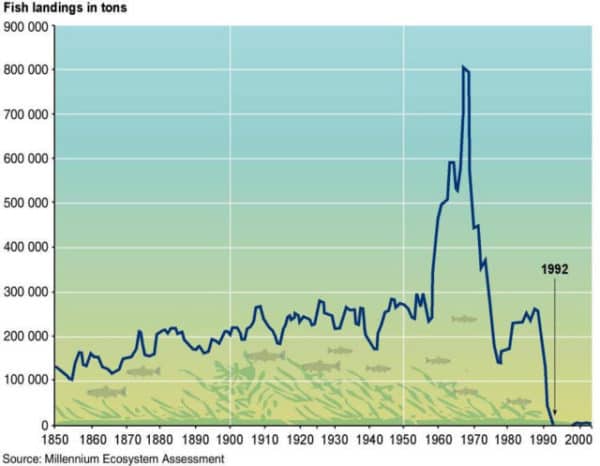
Graph of North Atlantic cod fishery, fish landing in tonnes, 1850 to 2000
Codfish catch, North Atlantic, tonnes per year

Increasingly, the ideas of economists guide the actions of our elected leaders and shape the societies and communities in which we live.  This means that incorrect or outdated economic theories can result in damaging policy errors.  So we should be concerned to learn that economics has failed to take into account a key transition: from a world relatively empty of humans and their capital equipment to one now relatively full.

A small minority of economists do understand that we have made an important shift.  In the 1990s, Herman Daly and others developed the idea that we have shifted to “full-world economies.”  (See pages 29-40 here.)  The North Atlantic cod fishery illustrates this transition.  This week’s graph shows tonnes of codfish landed per year, from 1850 to 2000.

Fifty years ago, when empty-world economics still held, the fishery was constrained by a lack of human capital: boats, motors, and nets.  At that time, adding more human capital could have caused the catch to increase.  Indeed, that is exactly what happened in the 1960s when new and bigger boats with advanced radar and sonar systems were deployed to the Grand Banks and elsewhere.  The catch tripled.  The spike in fish landings is clearly visible in the graph above.

But in the 1970s and ’80s, a shift occurred: human capital stocks—those fleets of powerful, sonar-equipped trawlers—expanded so much that the limiting factor became natural capital: the supply of fish.  The fishery began to collapse and no amount of added human capital could reverse the decline.  The system had transitioned from one constrained by human capital to one constrained by natural capital—from empty-world to full-world economics.  A similar transition is now evident almost everywhere.

An important change has occurred.  Unfortunately, economics has not internalized or adapted to this change.  Economists, governments, and business-people still act as if the shortage is in human-made capital.  Thus, we continue our drive to amass capital—we expand our factories, technologies, fuel flows, pools of finance capital, and the size of our corporations, in order to further expand the quantity and potency of human-made capital stocks.  Indeed, this is a defining feature of our economies: the endless drive to expand and accumulate supplies of capital.  That is why our system is called “capitalism.”  And a focus on human-made capital was rational when it was in short supply.  But now, in most parts of the world, human capital is too plentiful and powerful and and, thus, destructive.  It is nature and natural capital that is now scarce and limiting.  This requires an economic and civilizational shift: away from a focus on amassing human capital and toward a focus on protecting and maximizing natural capital: forests, soils, water, fish, biodiversity, wild animal populations, a stable climate, and intact ecosystems.  Failure to make that shift will push more and more of the systems upon which humans depend toward a collapse that mirrors that of the cod stock.

Graph source:  United Nations GRID-Arendal, “Collapse of Atlantic cod stocks off the East Coast of Newfoundland in 1992