Through the mill: 150 years of wheat price data

Graph of wheat price, western Canada (Sask. or Man.), farmgate, dollars per bushel, 1867–2017
Wheat price, western Canada (Sask. or Man.), farmgate, dollars per bushel, 1867–2017

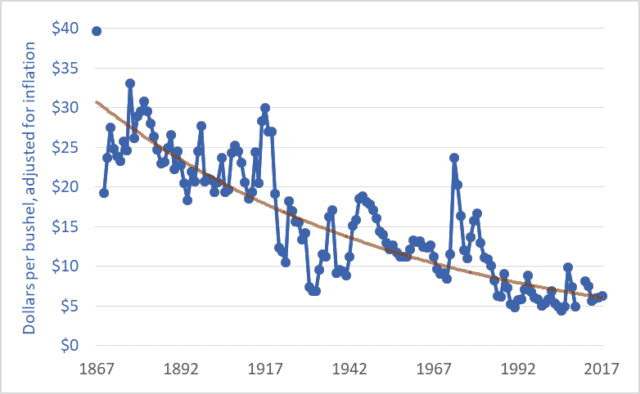
The price of wheat is declining, and it has been for many years.  The same is true for the prices of other grains and oilseeds.  The graph above shows wheat prices in Canada since Confederation—over the past 150 years.  The units are dollars per bushel.  A bushel is 60 pounds (27 kilograms).  The brown line suggests a trendline.

These prices are adjusted for inflation.  The downward trend reflects the fact that wheat prices fell relative to prices for nearly all other goods and services; as time went on it took more and more bushels of wheat or other grains to buy a pair of shoes, lunch, or a movie ticket.  For example, my father bought a new, top-of-the-line pickup truck in 1976 for $6,000, equivalent to about 1,200 bushels of wheat at the time.  Today, a comparable pickup (base model) might cost the equivalent of about 4,000 bushels of wheat.  As a second example, a house in 1980 might have cost the equivalent of 20,000 bushels of wheat; today, that very same house would cost the equivalent of 60,000 bushels.

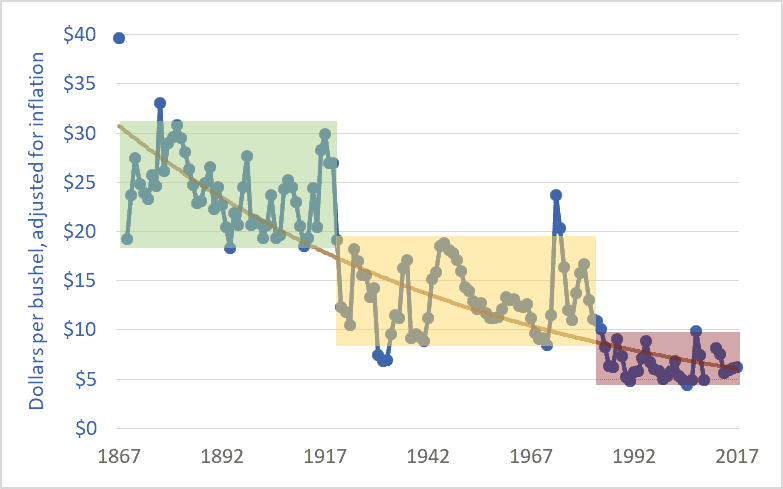
The graph below adds shaded boxes to highlight three distinct periods in Canadian wheat prices.  The period from Confederation to the end of the First World War saw prices roughly in the range of $20 to $30 per bushel (adjusted to today’s dollars).  From 1920 to the mid-’80s, prices entered a new phase, and oscillated between about $8 and $18 per bushel.  And in 1985, wheat prices entered a third phase, oscillating between $5 and $10 per bushel, more often closer to $5 than $10.  In each phase, the top of the range in a given period is roughly equal to the bottom of the range in the previous period.
Graph of wheat price, western Canada (Sask. or Man.), farmgate, dollars per bushel, 1867–2017
Wheat price, western Canada, farmgate, dollars per bushel

1985 is often cited as the beginning of the farm crisis period.  The graph above shows why the crisis began in that year.  Grain prices since the mid-’80s have been especially damaging to Canadian agriculture.  The post-1985 collapse in grain prices has had several effects:

– The expulsion of one-third of Canadian farm families in just one generation;
– The expulsion of two-thirds of young farmers (under 35 years of age) over the same period;
– A tripling of farm debt, to a record $102 billion;
– A chronic need to transfer taxpayer dollars to farmers through farm-support programs (with transfers totaling $110 billion since 1985); and
– A push toward farm giantism, with the majority of land in western Canada now operated by farms larger than 3,000 acres, and with many farms covering tens-of-thousands of acres.

As per-bushel and per-acre margins fall, the solution is to cover more acres.  The inescapable result is fewer farms and farmers.

It is impossible to delve into all the causes of the grain price decline in one blog post.  Briefly, farmers are getting less and less because others are taking more and more.  A previous blog post highlighted the widening gap between what Canadians pay for bread in the grocery store and what farmers receive for wheat at the elevator.  This widening gap is created because grain companies, railways, milling companies, other processors, and retailers are taking more and more, chocking off the flow of dollars to farmers.  This is manifest in declining prices.  Agribusiness giants are profiting by charging consumers more per loaf and paying farmers less per bushel.

Of course, grain prices are a function of domestic and international markets.  The current free trade and globalization era began in the mid-1980s.  (The Canada-US Free Trade Agreement was concluded in 1987, the North American Free Trade Agreement in 1994, and the World Trade Organization Agreement on Agriculture in 1995.)  The effect of free trade and globalization has been to plunge all the world’s farmers into a single, borderless, hyper-competitive market.  At the same time, agribusiness corporations entered a period of accelerating mergers in order to reduce the competition they faced.  As competition levels increase for farmers and decrease for agribusiness corporations it is easy to predict shifts in relative profitability.  Increased competition for farmers meant lower prices while decreased competition for agribusiness transnationals translated into higher prices and profits.

Graph sources:
– 1867–1974: Historical Statistics of Canada, eds. Leacy, Urquhart, and Buckley, 2nd ed. (Ottawa: Statistics Canada, 1983);
– 1890–1909: Wholesale Prices in Canada, 189O–19O9, ed. R. H. Coats (Ottawa: Government Printing Bureau, 1910);
– 1908–1984: Statistics Canada, Table: 32-10-0359-01 Estimated areas, yield, production, average farm price and total farm value of principal field crops (formerly CANSIM 001-0017);
– 1969–2009: Saskatchewan Agriculture and Food: Statfact, Canadian Wheat Board Final Price for Wheat, basis in store Saskatoon;
– 2012–2018: Statistics Canada, Table: 32-10-0077-01 Farm product prices, crops and livestock (formerly CANSIM 002-0043).

We’re in year 30 of the current climate crisis

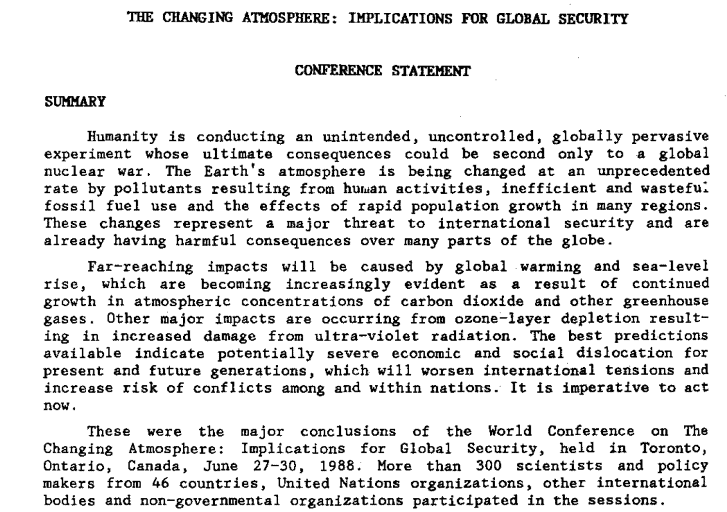
An excerpt from the Conference Statement of the 1988 World Conference on the Changing Atmosphere held in Toronto

In late-June, 1988, Canada hosted the world’s first large-scale climate conference that brought together scientists, experts, policymakers, elected officials, and the media.  The “World Conference on the Changing Atmosphere: Implications for Global Security” was held in Toronto, hosted by Canada’s Conservative government, and attended by hundreds of scientists and officials.

In their final conference statement, attendees wrote that “Humanity is conducting an unintended, uncontrolled, globally pervasive experiment whose ultimate consequences could be second only to a global nuclear war.”  (See excerpt pictured above.)  The 30-year-old conference statement contains a detailed catalogue of causes and effects of climate change.

Elizabeth May—who in 1988 was employed by Canada’s Department of Environment—attended the conference.   In a 2006 article she reflected on Canada’s leadership in the 1980s on climate and atmospheric issues:

“The conference … was a landmark event.  It was opened by Prime Minister Mulroney, who spoke then of the need for an international law of the atmosphere, citing our work on acid rain and ozone as the first planks in this growing area of international environmental governance…. 

Canada was acknowledged as the leader in hosting the first-ever international scientific conference on climate change, designed to give the issue a public face.  No nation would be surprised to see Canada in the lead.  After all, we had just successfully wrestled to the ground a huge regional problem, acid rain, and we had been champions of the Montreal Protocol to protect the ozone layer.”

The Toronto conference’s final statement also called on governments and industry to work together to “reduce CO2 emissions by approximately 20% … by the year 2005…. ”  This became known as the Toronto Target.  Ignoring that target and many others, Canada has increased its CO2 emissions by 29 percent since 1988.

Other events mark 1988 as the beginning of the modern climate-change era.  In 1988, governments and scientists came together to form the United Nations Intergovernmental Panel on Climate Change (IPCC). Since its formation, IPCC teams of thousands of scientists have worked to create five Assessment Reports which together total thousands of pages.

Also in 1988, NASA scientist Dr. James Hansen told a US congressional committee that climate change and global warming were already underway and that he was 99 percent certain that the cause was a buildup of carbon dioxide and other gases released by human activities.  Thirty years ago, Hansen told the committee that “It is time to stop waffling so much and say that the evidence is pretty strong that the greenhouse effect is here.” The New York Times and other papers gave prominent coverage to Hansen’s 1988 testimony.

Fast-forward to recent weeks.  Ironically, in Toronto, the site of the 1988 conference, and 30 years later, almost to the day, newly elected Ontario Premier Doug Ford announced he was scrapping Ontario’s carbon cap-and-trade emission-reduction plan, he vowed to push back against any federal-government moves to price or tax carbon, and he said he would join a legal challenge against the federal legislation.  In effect, Ford and premiers such as Saskatchewan’s Scott Moe have pledged to fight and stop Canada’s flagship climate change and emission-reduction initiative.  To do so, 30 years into the modern climate change era, is foolhardy, destructive, and unpardonable.

Citizens need to understand that when they vote for leaders such as Doug Ford (Ontario), Scott Moe (Saskatchewan), Jason Kenney (Alberta), or Andrew Scheer (federal Conservative leader) they are voting against climate action.  They are voting for higher emissions; runaway climate change; melting glaciers and permafrost; submerged seaports and cities worldwide; hundreds of millions of additional deaths from heat, floods, storms, and famines; and crop failures in this country and around the world.  A vote for a leader who promises inaction, slow action, or retrograde action is a vote to damage Canada and the Earth; it is a vote for economic devastation in the medium and long term, for dried-up rivers and scorched fields.  A vote for Moe, Ford, Kenney, Scheer, Trump, and a range of similar leaders is a vote to unleash biosphere-damaging and civilization-cracking forces upon our grandchildren, upon the natural environment, and upon the air, water, soil, and climate systems that support, provision, nourish, and enfold us.

In the 1990s, in decade one of the current climate crisis, inaction was excusable.  We didn’t know.  We weren’t sure.  We didn’t have the data.

As we enter decade four, inaction is tantamount to reckless endangerment—criminal negligence.  And retrograde action, such as that from Ford, Moe, Trump, and others, is tantamount to vandalism, arson, ecocide, and homicide.  How we vote and who we elect will affect how many forests burn, how many reefs disappear, and how many animals and people die.

In the aftermath of every crime against humanity (or against the planet or against the future) there are individuals who try to claim “I didn’t know.”  In year 30 of the current climate-change era, none can make that claim.  We’ve known for 30 years that the ultimate consequences of ongoing emissions and climate change “could be second only to a global nuclear war.”

If you’re for pipelines, what are you against?

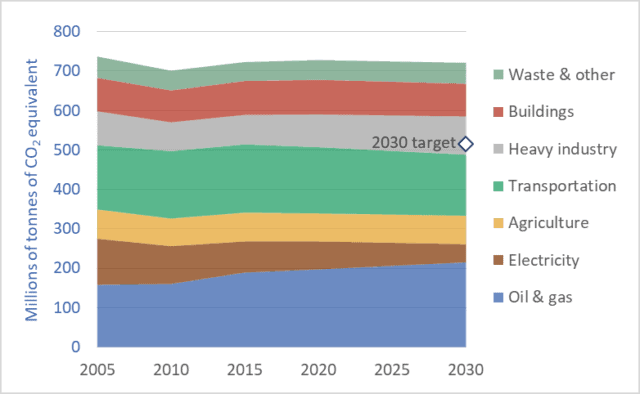
Graph of Canadian greenhouse gas emissions, by sector, 2005 to 2039
Canadian greenhouse gas emissions, by sector, 2005 to 2030

As Alberta Premier Notley and BC Premier Horgan square off over the Kinder Morgan / Trans Mountain pipeline, as Alberta and then Saskatchewan move toward elections in which energy and pipelines may be important issues, and as Ottawa pushes forward with its climate plan, it’s worth taking a look at the pipeline debate.  Here are some facts that clarify this issue:

1.  Canada has committed to reduce its greenhouse gas (GHG) emissions by 30 percent (to 30 percent below 2005 levels by 2030).

2.  Oil production from the tar sands is projected to increase by almost 70 percent by 2030 (From 2.5 million barrels per day in 2015 to 4.2 million in 2030).

3.  Pipelines are needed in order to enable increased production, according to the Canadian Association of Petroleum Producers (CAPP) and many others.

4.  Planned expansion in the tar sands will significantly increase emissions from oil and gas production.  (see graph above and this government report)

5.  Because there’s an absolute limit on our 2030 emissions (515 million tonnes), if the oil and gas sector is to emit more, other sectors must emit less.  To put that another way, since we’re committed to a 30 percent reduction, if the tar sands sector reduces emissions by less than 30 percent—indeed if that sector instead increases emissions—other sectors must make cuts deeper than 30 percent.

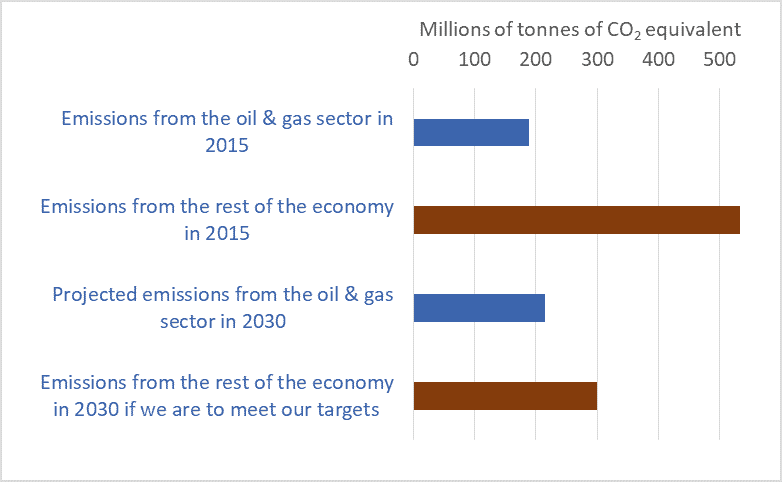
The graph below uses the same data as the graph above—data from a recent report from the government of Canada.  This graph shows how planned increases in emissions from the Alberta tar sands will force very large reductions elsewhere in the Canadian economy.

Graph of emissions from the Canadian oil & gas sector vs. the rest of the economy, 2015 & 2030
Emissions from the Canadian oil & gas sector vs. the rest of the economy, 2015 & 2030

Let’s look at the logic one more time: new pipelines are needed to facilitate tarsands expansion; tarsands expansion will increase emissions; and an increase in emissions from the tarsands (rather than a 30 percent decrease) will force other sectors to cut emissions by much more than 30 percent.

But what sector or region or province will pick up the slack?  Has Alberta, for instance, checked with Ontario?  If Alberta (and Saskatchewan) cut emissions by less than 30 percent, or if they increase emissions, is Ontario prepared to make cuts larger than 30 percent?  Is Manitoba or Quebec?  If the oil and gas sector cuts by less, is the manufacturing sector prepared to cut by more?

To escape this dilemma, many will want to point to the large emission reductions possible from the electricity sector.  Sure, with very aggressive polices to move to near-zero-emission electrical generation (policies we’ve yet to see) we can dramatically cut emissions from that sector.  But on the other hand, cutting emission from agriculture will be very difficult.  So potential deep cuts from the electricity sector will be partly offset by more modest cuts, or increases, from agriculture, for example.

The graph at the top shows that even as we make deep cuts to emissions from electricity—a projected 60 percent reduction—increases in emissions from the oil and gas sector (i.e. the tar sands) will negate 100 percent of the progress in the electricity sector.  The end result is, according to these projections from the government of Canada, that we miss our 2030 target.  To restate: according to the government’s most recent projections we will fail to meet our Paris commitment, and the primary reason will be rising emissions resulting from tarsands expansion.  This is the big-picture context for the pipeline debate.

We’re entering a new era, one of limits, one of hard choices, one that politicians and voters have not yet learned to navigate.   We are exiting the cornucopian era, the age of petro-industrial exuberance when we could have everything; do it all; have our cake, eat it, and plan on having two cakes in the near future.  In this new era of biophysical limits on fossil fuel combustion and emissions, on water use, on forest cutting, etc. if we want to do one thing, we may be forced to forego something else.  Thus, it is reasonable to ask: If pipeline proponents would have us expand the tar sands, what would they have us contract?

Graph sources: Canada’s 7th National Communication and 3rd Biennial Report, December 2017

Saskatchewan’s new Climate Change Strategy: reckless endangerment

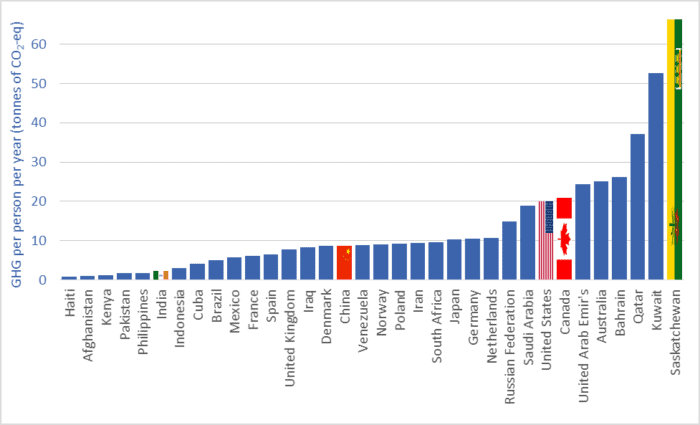
Graph of Saskatchewan greenhouse gas emissions relative to selected nations
Saskatchewan greenhouse gas emissions relative to selected nations

Saskatchewan’s greenhouse gas emissions are extremely high: 66 tonnes per person per year.  What if Saskatchewan was a country, instead of a province?  If that were the case, we’d find that no country on Earth had per-capita emissions higher than ours.

This week’s graph compares per-capita greenhouse gas (GHG) emissions in Saskatchewan to emissions in a variety of countries.  The units are tonnes of carbon dioxide equivalent (CO2-eq).  The data is for the years 2014 and 2015, the most recent years for which data is available.  The graph shows that Saskatchewan’s emissions are higher than those of petro-states such as Saudi Arabia and Qatar and manufacturing nations such as China and Germany.

Our world-topping per-person emissions form part of the context for this week’s release of the Government of Saskatchewan’s climate strategy: Prairie Resilience: A Made-in-Saskatchewan Climate Change Strategy.  The report isn’t really a plan of action—more an attempt at public relations and a collection of re-announcements.   Most critically, it lacks a specific set of measures that can, taken together, enable citizens and businesses in this province to reduce our GHG emissions by 30 percent by 2030.  I’ll review some of the key points of the document, but first just a bit more context.

In Paris in 2015, the world’s governments reaffirmed a target of limiting global temperature increases to 2 degrees Celsius (relative to pre-industrial levels).  However, more and more scientists are warning that 2 degrees is not a “safe level,” and that temperature increases of this magnitude will create floods, droughts, storms, and deaths in many parts of the world.  But a 2 degree rise is better than 4 or 5 degrees.

So that’s the first point: our 2 degree target is weak.  To this we’ve added inadequate emission-reduction commitments.  In the lead-up to the Paris climate talks the world’s governments each submitted specific emission-reduction commitments.  Canada committed to cut this country’s emissions by 30 percent (below 2005 levels) by 2030.  Other nations made similar pledges.  But here’s the troubling part: When you add up all those emissions-reduction commitments you find that they put the world on track, not for 2 degrees of warming, but for 3.2 degrees (UN Emissions Gap Report 2017).  So this is the context for recent climate change strategies from Saskatchewan and other provinces: These plans amount to inadequate provincial contributions to an inadequate national commitment to a weak international target.

One final bit of context: not only are per-capita emissions in Saskatchewan among the highest in the world, they continue to increase: up 65 percent in a generation (1990 to 2015).  Some will want to excuse our province: it’s cold here.  But our per-capita emissions are almost twice as high as those in the Northwest Territories, nine times as high as in the Yukon, and four times as high as those in neighbouring Manitoba.  Others will want to talk about the fact that Saskatchewan is a resource-producing and agricultural province; our prosperity depends upon our ability to keep farming and mining and producing oil and gas.  There’s a grain of truth to some parts of that idea, but it simply cannot be the case that “prosperity” requires the emission of 66 tonnes of GHGs per person.  Citizens in every nation want prosperity.  But if everyone in the world felt entitled to emit GHGs at the same rate as us, there would soon be no Saskatchewan as we know it.  There would be a parched desert here, and submerged cities worldwide.  In a climate- and carbon-constrained world, prosperity simply cannot require Saskatchewan-sized emissions.

So, with this for context, what does the Saskatchewan Climate Change Strategy propose?  The government has re-committed to increasing the production of low-emission electricity—to the “expansion of renewable energy sources up to 50 per cent of generating capacity” by 2030.  This is good news and we must ensure that this happens, well before 2030, if possible.  But careful readers might note three things in the preceding commitment:  1. the words “up to.”  2. generating capacity is not the same as output; because of the intermittent nature of wind power, for example, 50 percent of capacity will not equate to 50 percent of production.  3. electricity provides less than 30 percent of Saskatchewan’s total energy demand.  Thus, moving to 50 percent renewable/low-emission sources for electricity leaves 80+ percent of Saskatchewan’s energy needs filled by high-emission fossil fuels.

The Climate Change Strategy includes the creation of a technology fund.  But this is not new.  The government passed legislation in 2010 requiring large emitters to pay into a green technology fund.  That law was never put into force.

Predictably, the Strategy rejects a carbon tax, arguing that such a tax “would make it more difficult for our province to respond effectively to climate change because a simple tax will not result in the innovations required to actually reduce emissions.”

The Strategy also includes a vague mix of commitments to reporting, potential future measures to reduce methane emissions, emission-intensity targets, and offset trading.  Think of this as a cap-and-trade system without a cap.

The Strategy includes some positive steps but fails to deliver what we need: a comprehensive, detailed plan that will result in a 30 percent reduction in emissions by 2030.  This failing is especially evident when one takes into account probable emissions increases that may result from economic growth, planned increases in energy production, and increased use of agricultural inputs such as nitrogen fertilizer.  (Applied tonnage of N fertilizer has doubled since 2002.)

Overall, the Strategy steers away from discussions of emissions reduction and focuses instead on the idea of “resilience.”  That word appears 44 times in 12 pages.  The report defines resilience as “the ability to cope with, adapt to, and recover from stress and change.”  But resilience—coping, adapting, and recovering—may simply prove impossible in the face of the magnitude of climate change that will scorch our province under a business-as-usual scenario.  The high-emission, fossil-fuel-dependent future assumed in the Climate Change Strategy would raise the average temperature of this province by 6 to 8 degrees Celsius (sources available on request).  Climate disruption of that magnitude vetoes adaptation and mocks resilience.

And even if we in Saskatchewan could find ways to adapt and make ourselves resilient in the face of the blows that may be inflicted by a hotter, stormier, more damaging climate, we must ask: Will poor and vulnerable populations around the world be able to make themselves “resilient” to the climate change that our emissions trigger?   The global proliferation of Saskatchewan-level emissions would cause cities to disappear under the waves, food-growing regions to bake and wither, and tropical storms to become more numerous and damaging.  What is our ethical position if we are among the greatest contributors to these calamities, yet all we offer affected populations is the advice to make themselves more resilient?

A real plan is possible.  Emission reductions of 30 percent by 2030 are attainable at costs that Saskatchewan can afford.  Holding global temperature increases to 2 degrees also remains possible.  All this can be accomplished if governments act with courage and integrity, rapidly and effectively, and in the interests of citizens and the future.

Graph sources:
Saskatchewan and other provinces: Environment and Climate Change Canada, Canadian Environmental Sustainability Indicators: Greenhouse Gas Emissions.
Other nations: World Resources Institute, CAIT Climate Data Explorer.


Improvident province: Saskatchewan government debt

Total Saskatchewan provincial government debt, 1977 to 2017

   ‘Improvident’: Lacking foresight; spendthrift; failing to provide for the future.  

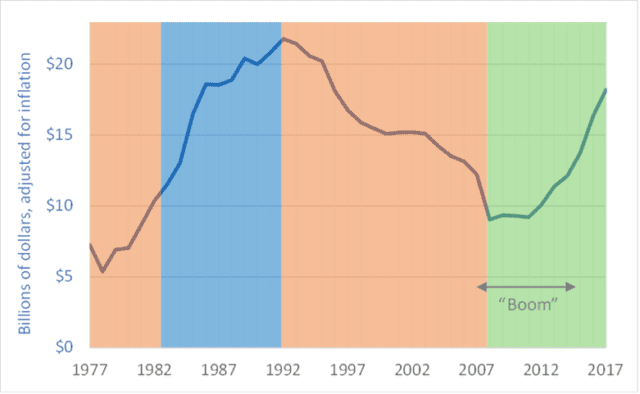
This week’s graph shows total Saskatchewan government debt, adjusted for inflation, for the period 1977 to 2017.  The coloured shading indicates the political party in power at the time: orange for New Democratic Party, blue for the Conservative Party, and green for the Saskatchewan Party.

From 2007 to 2015, Saskatchewan experienced an economic boom.  In 2007 and ’08, commodity values spiked and pushed up the prices of potash, uranium, oil, natural gas, lumber, and grains and oilseeds.  Provincial gross domestic product (GDP) rose sharply.  Even after the financial problems of 2008, a revival in energy prices and energy-sector expansion in this province and neighboring Alberta kept demand for employees strong and wages high (for many workers, though not all).  Since the boom began, housing prices in Saskatchewan have nearly doubled.  Saskatchewan went from being a have-not province to a prosperous and swaggering economic leader.

As resource royalties rose and taxable incomes and sales increased, provincial tax inflows initially swelled.  One could imagine that the provincial government would take advantage of these windfalls to pay down Saskatchewan’s debt.  The government did not.  Instead, it cut taxes and embarked on several ill-conceived spending projects.  Corporate income taxes in Saskatchewan are now, according to the government, the lowest in the country (source here).  As the graph shows, after 16 years of paying down the debt (1992-2008), that pay-down ended in 2009, just as the Saskatchewan economy was heating up.

Initially, provincial debt levels stayed relatively constant as the boom proceeded, but debt began increasing in 2012.  Since then, Saskatchewan’s provincial government debt has doubled, with much of the increase racked up before the economic good times ended. Even as the economy was prospering the government was borrowing money.

Having squandered its chance to pay down debt, save for a rainy day, or build up a financial cushion, the Saskatchewan government came to the end of the economic upturn only to find itself in an increasingly dire financial situation.  In its most recent budget, the province took several draconian steps to try to control its self-inflicted deficits and restrain its ballooning debt.  The government:
– shut down the province’s bus company;
– cut transfers to cities;
– reduced funding to libraries;
– eliminated funding for home repairs for people on social assistance;
– reduced wages for civil servants;
– cut subsidized podiatry services (creating a risk of increased foot amputations for diabetics and others);
– cut subsidies for hearing aids for children; and
– eliminated funding to pay for funerals for its poorest citizens.

Projections by the provincial government show that by 2020 the province’s debt will return to levels not seen since 1992.  In that year, provincial government cabinet ministers were forced to fly to New York City to meet with bond-rating agencies to prevent those agencies from downgrading provincial debt to “junk” status.  The specter of a return to those levels of debt shows that the government of Saskatchewan truly bungled the boom.

Graph sources: data obtained by request from the Economic & Fiscal Policy Branch of Saskatchewan’s Ministry of Finance