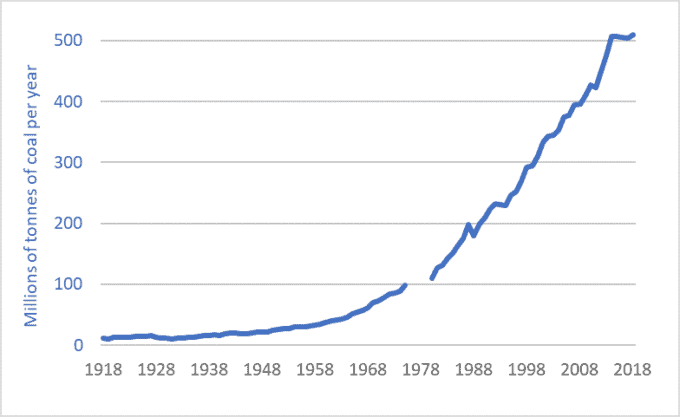
Self-incineration? 100 years of Australian coal production

Graph of Australian coal production, historic, 1918-2018

I’m saddened and horrified by the pictures of the fires in Australia.  But the graph above gives the context for those fires and other instances of climate chaos and destruction.  To some extent, what we’re witnessing in Australia is time-delayed arson, in that humans have applied “accelerants.”

But let’s not be smug or think of this as a problem “over there.”  Graphs of Canadian and US oil production would appear nearly identical to this graph of Australian coal.  Moreover, it’s not just emissions from Australian coal that are contributing to the firestorms in that country, but Canadian and US and EU and Chinese emissions as well.  Each of us, in our flying and driving and consuming, have contributed to this carnage.  Greenhouse gas (GHG) emissions from one place will contribute to melting a glacier in another place, damaging a reef in another, and intensifying a fire in yet another.

Sadly, a major part of the Anthropocene will be the Pyrocene.  Our petro-industrial emissions are pushing the planet, biosphere, and our communities into a new age of megafires.

Let’s conclude with some insights from the coal corporations and their industry associations:

“The Australian coal industry is a key pillar of the Australian economy….  Coal benefits all Australians through its contribution to exports, wages, investment and tax revenue.  It is Australia’s comparative advantage in coal … that has helped to sustain the longest period of continuous economic growth in the nation’s history.  …  Australia [is] the fourth largest producer of black coal in the world. …  This production is possible because Australia has vast resources of coal. …  At current production rates these resources will sustain production of black coal for 125 years and lignite for over 1,200 years” [italics added].—Minerals Council of Australia, “Coal’s Economic Contribution

Sources for Graph:
– B.R. Mitchell, International Historical Statistics: The Americas and Australasia (London: The Macmillan Press, 1983), Table E2, p. 404;
– U.S. Energy Information Administration, International Energy Statistics 
See also:
– Reserve Bank of Australia, “The Changing Global Market for Australian Coal” (Bulletin – September 2019  Global Economy) 
Australian Commodity Statistics 2006, p. 244 & 245 

New report on agriculture, GHG emissions, climate change, and the farm income crisis

Cover of Tackling the Farm Crisis and the Climate Crisis by Darrin Qualman

How can we reduce agricultural greenhouse gas (GHG) emissions by half by mid-century?  And how can steps to do so help strengthen and safeguard family farms?  These two questions are the focus of a new report written by Darrin Qualman in collaboration with the National Farmers Union (NFU).  The report is entitled Tackling the Farm Crisis and the Climate Crisis: A Transformative Strategy for Canadian Farms and Food Systems and it’s available from the NFU website.

The report looks at the climate crisis and the farm income crisis.  It concludes that our farms’ high emissions and low net incomes have the same cause: overdependence on purchased inputs: fertilizers, chemicals, fuels, etc.

The report shows clearly that the GHG emissions coming out of our farm and food systems are simply the downstream byproducts of the petro-industrial inputs we push in.  “Push in millions of gallons of fossil fuels and they will come out as millions of tonnes of carbon dioxide.  Push in megatonnes of fertilizers and they will come out as megatonnes of nitrous oxide.  As we have doubled and redoubled input use, we have doubled and redoubled the GHG emissions from agriculture,” states the report.  From this novel observation comes an inescapable conclusion: “Any low-emission food system will be a low-input food system.”

The report takes a long-term view and states that “10,000 years of human history makes one thing crystal clear: farming does not create GHG emissions; petro-industrial farm inputs create GHG emissions.”  It goes on to state that “Two things happen when farmers become overdependent on  purchased inputs: emissions go up, and net incomes go down.”

The report is optimistic, however, arguing that solutions to climate problems can also be solutions to farm income problems.  On average, farmers are now retaining just five cents out of every dollar they earn.  The other 95 cents go to pay for inputs—to pay fertilizer, chemical, seed, fuel, and machinery companies and other input and service providers.  But as input use is reduced as a way to reduce emissions, margins and net incomes can go up.  Steps to deal with the climate crisis can also be steps to solve the farm income crisis.

The report explores dozens of practical on-farm measures and government policies that can, taken together, reduce agricultural emissions by half by mid-century.  The report, however, does not underestimate the scale of the task ahead.  It acknowledges that “farmers, other citizens, all sectors, and all levels of government must mobilize, with near-wartime-levels of commitment and effectiveness, to slash emissions.  ”

The report is a hopeful blueprint for the transformation of our farms and food systems.  “We are looking at a future wherein agriculture must increasingly re-merge with nature and culture to create a much more integrated, life-sustaining, and community-sustaining agroecological model of human food provision, nutrition, and health.”

Darrin Qualman worked as Director of Research for the National Farmers Union from 1996 to 2010.  He is the author of the book, published in 2019, Civilization Critical: Energy, Food, Nature, and the Future.

Click HERE to read the report.

The nitrogen crisis: the other mega-threat to the biosphere

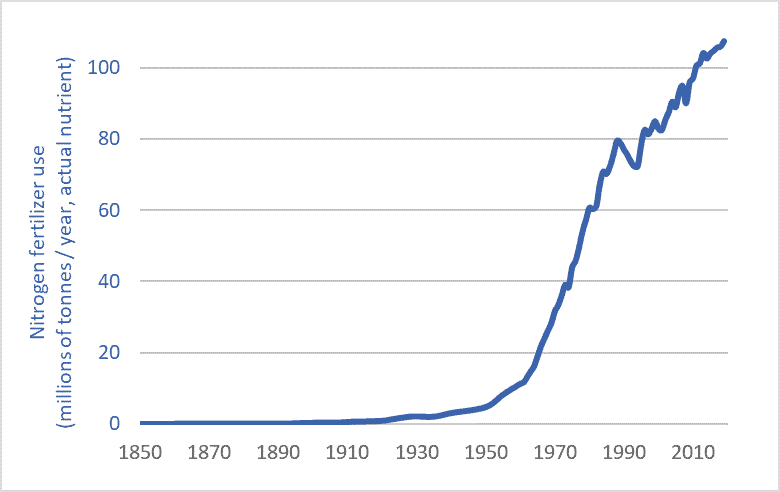
Nitrogen fertilizer use graph historic long-term 1850-2019
Global nitrogen fertilizer use, 1850-2019

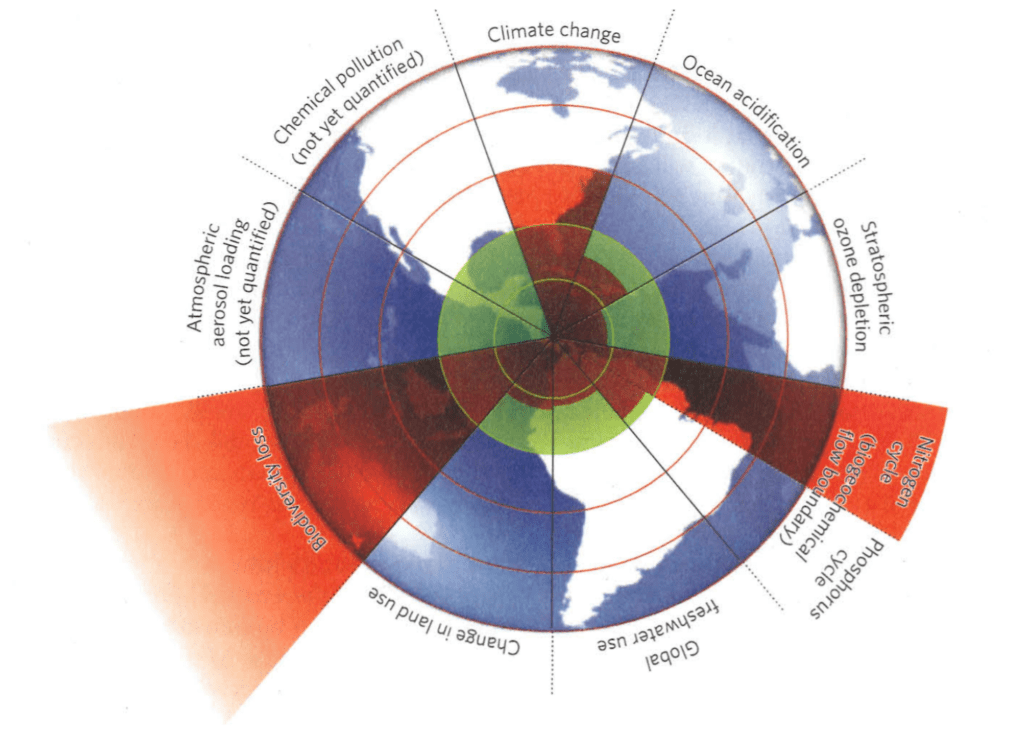
If there was no climate crisis we’d all be talking about the nitrogen crisis.  Humans have super-saturated Earth’s biosphere with reactive nitrogen, setting off a cascade of impacts from species shifts, ecosystem changes, and extinctions to ocean dead zones and algae-clogged lakes.  When scientists surveyed the many threats to the biosphere to determine a “safe operating space” for planet Earth, the areas in which they concluded that we’d pushed furthest past “planetary boundaries” were climate change, species extinction, and nitrogen flows.  The graphic below, from the journal Nature, shows the extent to which we’ve transgressed safe planetary boundaries.  Note nitrogen—the red wedge, lower right.

Planetary Boundaries Rockstrom Steffen et al

Source: Reproduced from: Johan Rockström, Will Steffen, et al., “A Safe Operating Space for Humanity,” Nature 461, no. 24 (2009).

A nitrogen primer

Nitrogen is indispensable for life—a building block of proteins and DNA.  Nitrogen (N) is one of the most important plant nutrients and the most heavily applied agricultural fertilizer.  Nitrogen  is common in the atmosphere—making up 78 percent of the air we breath.  But this atmospheric N is inert; non-reactive—it can’t be used by plants.  In contrast, reactive, plant-usable N is just one-one-thousandth as abundant in the biosphere as nitrogen gas is in the atmosphere.  For hundreds-of-millions of years, plants have struggled to find sufficient quantities of usable N.

But humans have intervened massively in the planet’s nitrogen cycles—effectively tripling the quantity of N flowing through terrestrial ecosystems—through farmland, forests, wetlands, and grasslands.  In intensively cropped areas, nitrogen flows are now ten times higher than natural levels.

Here’s the most important part: nitrogen is a fossil-fuel product.  Natural gas is the main input for making N fertilizer.  That gas provides the tremendous energy, heat, and pressure needed to split atmospheric nitrogen molecules and combine N atoms with hydrogen to make reactive compounds.  The amount of energy needed to create, transport, and apply one tonne of N fertilizer is nearly equal to two tonnes of gasoline.  Nitrogen is one way that we push fossil-fuel energy into the food system in order to push more food out.  We turn fossil fuels into fertilizer into food into us.

Humans managed to increase global food production about eight-fold during the 20th and early 21st centuries.*  There’s more tonnage coming out of our food system.  But that system is linear, so if there’s more food coming out one end, there must be more inputs being pushed into the other end—more energy, chemicals, and fertilizers.  The graph above shows how humans have increased N fertilizer inputs three-hundred-fold since 1900 and thereby helped increase human food outputs eight-fold, and human populations four-and-a-half-fold.  By pushing in a hundred million tonnes of fossil-fuel-derived fertilizer we can push out enough food to feed an additional six billion people.  (for more information on nitrogen, see chapters 3 and 28 of my recent book, Civilization Critical.)

Greenhouse gas emission from nitrogen fertilizer

The nitrogen crisis is compounded by the fact that N production and use drive climate change.  The production and use of nitrogen fertilizer is unique among human activities in that it produces large quantities of all three of the main greenhouse gases: carbon dioxide (from fertilizer-production facilities fueled by natural gas); nitrous oxide (from soils over-enriched by factory-made N); and methane (from the production and distribution of natural gas feedstocks and from the fertilizer-production process, i.e., from fracking, leaking gas pipelines, and from emissions from fertilizer plants).  A 2019 science journal article reported that actual methane emissions from fertilizer plants may be 100 times higher than previously assumed.  Emissions from N fertilizer production and use make up about half the total emissions from agriculture in many regions.  It’s fertilizer, not diesel fuel, that’s the largest emissions source on many farms.

Alternatives

We cannot continue to push massive quantities of petro-industrial N fertilizer into our farm fields and ecosystems.   Luckily there are alternatives and partial solutions.  these include:
– Getting nitrogen from natural sources: legumes and better crop rotations;
– Scaling back our demand for agricultural products: reducing food waste; rethinking biofuels; minimizing nutritionally disfigured food (sugar pops and tater tots); ceasing the attempt to globally proliferate North American levels of meat consumption;
– Funding agronomic research into low-input, organic, and agro-ecological production systems;  and
– Rationalizing and democratizing our food system—moving away from systems based on yield-, output-, trade-, and profit-maximization; corporate control; farmer elimination; and energy- and emission-maximization to new paradigms based on food sovereignty, health and nutrition-maximization, input-optimization, emissions-reduction, and long-term sustainability.

Any maximum-input, maximum-output agricultural system will  be a high-emission system.  Input reduction, however, can boost sustainability and net farm incomes while reducing energy use and emissions.  Cutting N use is key.

* The FAO records a four-fold increase in grain production between 1950 and 2018 and it is likely that production roughly doubled between 1900 and 1950, so an eight- to ten-fold increase in production is likely between 1900 and 2018.

Graph sources:
International Fertilizer Association (IFA);
– Vaclav Smil, Enriching the Earth (Cambridge, MA: The MIT Press, 2001);
– UN Food and Agriculture Organization (FAO), FAOSTAT; and
– Clark Gellings & Kelly Parmenter, “Energy Efficiency in Fertilizer Production and Use.”


Another trillion tonnes: 250 years of global material use data

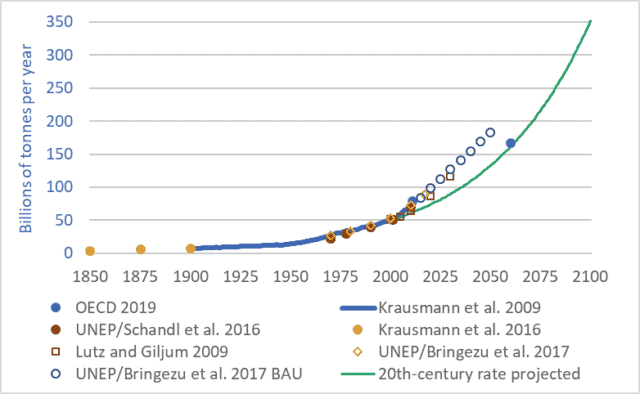
Graph of Global materials use 1850-2100
Global materials use, 1850-2100

Want to understand your society and economy and the fate of petro-industrial civilization?  If so, don’t “follow the money.”  The stock market casino, quantitative easing, derivatives and other “financial innovations,” and the trillions of e-dollars that flit through the global monetary system each day obscure the real economy—the production and destruction of actual wealth: mining, farming, processing, transport, manufacturing, consumption, disposal.  To understand where we are and where we may be going, we must follow more tangible flows—things that are real.  We must follow the oil, coal, steel, concrete, grain, copper, fertilizers, salt, gravel, and other materials.

Our cars, homes, phones, foods, fuels, clothes, and all the other products we consume or aspire to are made out of stuff—out of materials, out of wood, iron, cotton, etc.   And our economies consume enormous quantities of those materials—tens-of-billions of tonnes per year.

The graph above shows 250 years of actual and projected material flows through our global economy.  The graph may initially appear complicated, because it brings together seven different sources and datasets and includes a projection to the year 2100.  But the details of the graph aren’t important.  What is important is the overall shape: the ever-steepening upward trendline—the exponential growth.

In 1900, global material flows totalled approximately 7 billion tonnes.  The technical term for these material flows is “utilized materials”—the stuff we dig out of mines, pump up from oil or natural gas wells, cut down in forests, grow on farms, catch from the sea, dig out of quarries, and otherwise appropriate for human uses.  These tonnages do not include water, nor do they include unused overburden, but they do include mine tailings, though this last category adds just a few percent to the total.

Between 1900 and 2000, global material tonnage increased sevenfold—to approximately 49 billion tonnes (Krausman et al. 2009).  Tonnage rose to approx. 70 billion tonnes by 2010 (UNEP/Schandl 2016), and to approx. 90 billion tonnes by 2018 (UNEP/Bringezu 2018).  At the heart of our petro-industrial consumerist civilization is a network of globe-spanning conveyors that, each second, extract and propel nearly 3,000 tonnes of materials from Earth’s surface and subsurface to factories, cities, shops, and homes, and eventually on to landfills, rivers and oceans, and the atmosphere.  At a rate of a quarter-billion tonnes per day we’re turning the Earth and biosphere into cities, homes, products, indulgences, and fleeting satisfactions; and emissions, by-products, toxins, and garbage.

And these extraction, consumption, and disposal rates are projected to continue rising—to double every 30 to 40 years (Lutz and Giljum 2009).  Just as we increased material use sevenfold during the 20th century we’re on track to multiply it sevenfold during the 21st.  If we maintain the “normal” economic growth rates of the 20th century through the 21st we will almost certainly increase the volume and mass of our extraction, production, and disposal sevenfold by 2100.

But 2100 is a long way away.  Anything could happen by then.  Granted.  So let’s leave aside the long-term and look only at the coming decade.  Material throughput now totals about 90 billion tonnes per year, and is projected to rise to about 120 billion tonnes per year over the coming decade.  For ease of math, let’s say that the average over the coming decade will be 100 billion tonnes per year.  That means that between 2019 and 2029 we will extract from within the Earth and from the biosphere one trillion tonnes of materials: coal, oil, wood, fish, nickel, aluminum, chromium, uranium, etc.  …one trillion tonnes.  And we’ll send most of that trillion tonnes on into disposal in the ground, air, or water—into landfills, skyfills, and seafills.  In the coming decade, when you hear ever-more-frequent reports of the oceans filling with plastic and the atmosphere filling with carbon, think of that trillion tonnes.

Postscript: “dematerialization”

At conferences and in the media there’s a lot of talk of “dematerialization,” and its cousin “decarbonization.”  The idea is this: creating a dollar of economic activity used to require X units of energy or materials, but now, in countries such as Canada and the United States, creating a dollar of economic activity requires only two-thirds-X units.  Pundits and officials would have us believe that, because efficiency is increasing and less material and energy are needed per dollar, the economy is being “dematerialized.”  They attempt to show that the economy can grow and grow but we need not use more materials or energy.  Instead of consuming heavy steel cars, we will consume apps, massages, and manicures.  But this argument is wrong.  Global material and energy use increased manyfold during the 20th century.  The increases continue.  A business-as-usual scenario will see energy and materials use double every 30 to 40 years.  And just because the sizes of our economies, measured in abstract currencies, are growing faster, this does not change the fact that our use of energy and materials is growing.  “Dematerialization” has no useful meaning in a global economy in which we are using 90 billion tonnes of materials per year and projecting the use of 180 billion tonnes by 2050.  Our rate of extraction and consumption of materials is rising; the fact that the volume of dollar flows is rising faster is merely a distraction.

Sources for material flow tonnage:

Fridolin Krausmann et al., “Growth in Global Materials Use, GDP, and Population During the 20th Century,” Ecological Economics 68, no. 10 (2009).

Christian Lutz and Stefan Giljum, “Global Resource Use in a Business-as-Usual World: Updated Results from the GINFORS Model,” in Sustainable Growth and Resource Productivity: Economic and Global Policy Issues, ed. Bleischwitz et al. (Sheffield, UK: Greenleaf Publishing, 2009).

Stefan Giljum et al., Sustainable Europe Research Institute (SERI), “Resource Efficiency for Sustainable Growth: Global Trends and European Policy Scenarios,” background paper, delivered Sept. 10, 2009, in Manila, Philippines.

Julia Steinberger et al., “Global Patterns of Materials Use: A Socioeconomic and Geophysical Analysis,” Ecological Economics 69, no. 5 (2010).

UN Environmental Programme (UNEP) and H. Schandl et al., Global Material Flows and Resource Productivity: An Assessment Study of the UNEP International Resource Panel (Paris: UNEP, 2016).

Krausmann et al., “Long-term Trends in Global Material and Energy Use,” in Social Ecology: Society-Nature Relations across Time and Space, ed. Haberl et al. (Switzerland: Springer, 2016).

United Nations Environment Programme (UNEP), International Resource Panel, and Stefan Bringezu et al., Assessing Global Resource Use: A Systems Approach to Resource Efficiency and Pollution Reduction (Nairobi: UNEP, 2017).

Organization for Economic Cooperation and Development (OECD), Global Material Resources Outlook to 2060: Economic Drivers and Environmental Consequences (Paris: OECD Publishing, 2019)

Surrounded by Solutions: electric buses, solar panels, high-speed trains, and more

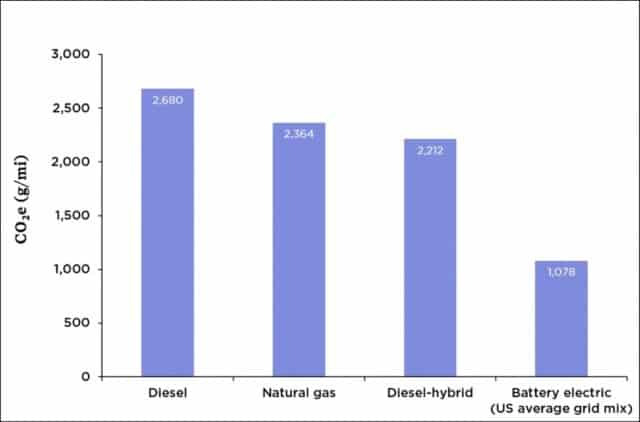
Graph of lifecycle GHG emissions for buses using various energy sources
Lifecycle greenhouse gas emissions for buses using various energy sources

Most North Americans have never seen an electric bus.  Admittedly, momentum is building—some jurisdictions, notably California, have committed to buying only electric transit buses after 2029.  But such buses remain rare in Canada and the United States.  A 2018 report found that just 0.2% of US buses (two in a thousand) were electric, and that tiny percentage is rising very slowly.  New York City provides an example of the modest pace of e-bus adoption—a three-year pilot project, adding just 10 electric buses to its fleet of 5,700.

How’s this for a contrast?  Shenzhen China has 16,000 electric buses—100% of its fleet.  And that city is not unusual in China.  Overall, that country has more than 400,000 electric buses, and is adding 100,000 more each year, with numbers projected to reach one million by 2023.

The graph above shows that electric buses can cut greenhouse gas (GHG) emissions by 60 percent (1,078 grams COequivalent per mile for electric vs. 2,680 grams for diesel).  These low emission values for e-buses take into account that much of North American electricity is generated by burning coal or natural gas.  If we assume a future in which most of our electricity can come from cleaner solar and wind sources then e-buses can reduce emissions by 85 percent compared to diesel.

In addition to having most of the planet’s low-emission buses, China is also leading the world in electric car production and sales.  In 2017, China produced more than half the world’s output of electric cars.  Chinese motorists purchased 580,000 EVs in 2017 while Americans purchased about 200,000 and Canadians 15,000.  Admittedly, many of those Chinese autos are small (think Smart Cars, not Teslas), but that is rapidly changing as Chinese cars become larger and more luxurious.  Indeed, their more modest size can be seen as part of the solution, as the production of small EVs creates lower emissions than the production of large ones.

China is also leading the world in high-speed rail—passenger trains that travel 250 to 350 km/h.  China has added 30,000 kms of new high-speed rail track since 2003 and plans to add another 10,000 kms by 2025, for a total of 40,000 kms—enough to circle the planet.  (For more information on the tremendous potential of high-speed rail, see this blog post, and this one.)

Finally, and this is well known, China dominates the world in solar-panel production and solar-power generation, with production and installation rates several times those in the Americas or EU.  Moreover, China is not the only country shaming us in terms of clean energy adoption: India installed more solar power capacity than the US in 2017 and again in 2018, and far more than Canada.

The four examples above illustrate something important about the current climate crisis: solutions are thick on the ground, but we in North America are simply choosing not to adopt them.  China has made itself the world’s largest solar panel manufacturer; the US has doubled-down on coal, and Canada continues to pin its economic fortunes on the carbon-fuel sector.  China is the world’s largest EV producer; in Canada and the US the best-selling vehicle is the Ford F-150.  China has built tens-of-thousands of kms of passenger-rail track; North Americans have doubled air travel.  We’re walking past mature and promising technologies—choosing to ignore them.

Granted, China has a larger population, but we in North America are far richer.  The combined size of the Canadian and US economies is double that of China’s economy.  Canadian per-capita GDP is five times higher than that of China, and US per-capita GDP is seven times higher.  For every dollar the average Chinese person has to spend on an electric car or solar panels, Canadians and Americans have five to seven dollars.

Moreover, we’re not dependent on foreign technologies or companies.  Canadian Solar, headquartered in Guelph, is one of the six largest solar panel companies in the world.  Bombardier, headquartered in Montreal, is one of the three largest producers of high-speed rail equipment in the world—supplying China with locomotives and rolling stock.  And New Flyer Bus Company, headquartered in Winnipeg, has delivered electric buses to several US and Canadian cities.

We’re not short of high-tech corporations—many world-leading technology companies are headquartered in Canada and the US.  We’re not without technological options.  And we’re not short of funds.  We have extremely promising options and opportunities.  We’re not doomed.  But we are reckless, indulgent, short-sighted, and despicably immoral.  And by continuing to act in the ways we are we will probably manage to doom ourselves.  But that need not be the case.  Solutions abound.

Let’s not dwell on the negative.  Instead, let’s acknowledge the tremendous upside potential and technological possibilities.  Solar panels and electric trains, buses, and cars are solutions close at hand.  Within a decade, North America could host tens-of-thousands of kms of new passenger rail track, hundreds-of-thousands of electric buses, tens-of-millions of electric vehicles, and billions of new solar panels.  This wouldn’t be a complete solution to the climate crisis, but it would be a very good start.

Graph source: Jimmy O’Dea and the Union of Concerned Scientists

Methane and climate: 10 things you should know

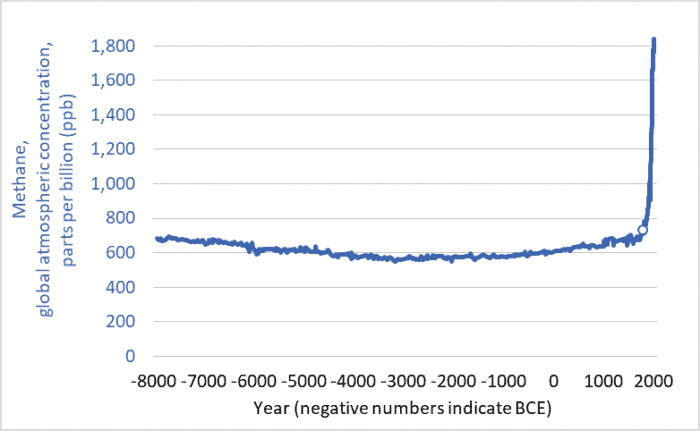
Graph of global atmospheric methane concentrations
Global atmospheric methane concentrations, past 10,000+ years (8000 BCE to 2018 CE)

The graph above shows methane concentrations in Earth’s atmosphere over the past 10,000+ years: 8000 BCE to 2018 CE.  The units are parts per billion (ppb).  The year 1800 is marked with a circle.

Note the ominous spike.  As a result of increasing human-caused emissions, atmospheric methane levels today are two-and-a-half times higher than in 1800.  After thousands of years of relatively stable concentrations, we have driven the trendline to near-vertical.

Here are 10 things you should know about methane and the climate:

1. Methane (CH4) is one of the three main greenhouse gases, along with carbon dioxide (CO2) and nitrous oxide (N2O).

2. Methane is responsible for roughly 20% of warming, while carbon dioxide is responsible for roughly 70%, and nitrous oxide the remaining 10%.

3. Methane is a powerful greenhouse gas (GHG).  Pound for pound, it is 28 times more effective at trapping heat than is carbon dioxide (when compared over a 100-year time horizon, and 84 times as effective at trapping heat when compared over 20 years).  Though humans emit more carbon dioxide than methane, each tonne of the latter traps more heat.

4. Fossil-fuel production is the largest single source.  Natural gas is largely made up of methane (about 90%).  When energy companies drill wells, “frac” wells, and pump natural gas through vast distribution networks some of that methane escapes.  (In the US alone, there are 500,000 natural gas wells, more than 3 million kilometers of pipes, and millions of valves, fittings, and compressors; see reports here and here.)  Oil and coal production also release methane—often vented into the atmosphere from coal mines and oil wells.  Fossil-fuel production is responsible for about 19% of total (human-caused and natural) methane emissions.  (An excellent article by Saunois et al. is the source for this percentage and many other facts in this blog post.)  In Canada, policies to reduce energy-sector methane emissions by 40 percent will be phased in over the next seven years, but implementation of those policies has been repeatedly delayed.

5. Too much leakage makes electricity produced using natural gas as climate-damaging as electricity from coal.  One report found that for natural gas to have lower overall emissions than coal the leakage rate would have to be below 3.2%.  A recent study estimates leakage in the US at 2.3%.  Rates in Russia, which supplies much of the gas for the EU, are even higher.  Until we reduce leakage rates, the advantage of shutting down coal-fired power plants and replacing them with natural gas generation will remain much more modest than often claimed.

6. Domestic livestock are the next largest source of methane.  Cattle, sheep,  and other livestock that graze on grass emit methane from their stomachs through their mouths.  This methane is produced by the symbiotic bacteria that live in the guts of these “ruminants” and enable them to digest grass and hay.  In addition, manure stored in liquid form also emits methane.  Livestock and manure are responsible for roughly 18% of total methane emissions.

7. Rice paddy agriculture, decomposing organic matter in landfills, and biomass burning also contribute to methane emissions.  Overall, human-caused emissions make up about 60% of the total.  And natural sources (wetlands, swamps, wild ruminants, etc.) contribute the remaining 40%.

8. There is lots of uncertainty about emissions.  Fossil fuel production and livestock may be responsible for larger quantities than is generally acknowledged.  The rise in atmospheric concentrations is precisely documented, but the relative balance between sources and sinks and the relative contribution of each source is not precisely known.

9. There is a lot of potential methane out there, and we risk releasing it.  Most of the increase in emissions in recent centuries has come from human systems (fossil fuel, livestock, and rice production; and landfills).  Emissions from natural systems (swamps and wetlands, etc.) have not increased by nearly as much.  But that can change.  If human actions continue to cause the planet to warm, natural methane emissions will rise as permafrost thaws.  (Permafrost contains huge quantities of organic material, and when that material thaws and decomposes in wet conditions micro-organisms can turn it into methane.)  Any such release of methane will cause more warming which can thaw more permafrost and release more methane which will cause more warming—a positive feedback.

Moreover, oceans, or more specifically their continental shelves, contain vast quantities of methane in the form of “methane hydrates” or “clathrates”—ice structures that hold methane stable so long as the temperature remains cold enough.  But heat up the coastal oceans and some of that methane could begin to bubble up to the surface.  And there are huge amounts of methane contained in those hydrates—the equivalent of more than 1,000 years of human-caused emissions.  We risk setting off the “methane bomb“—a runaway warming scenario that could raise global temperatures many degrees and catastrophically damage the biosphere and human civilization.

Admittedly, the methane bomb scenario is unlikely to come to pass.  While some scientists are extremely concerned, a larger number downplay or dismiss it.  Nonetheless a runaway positive feedback involving methane represents a low-probability but massive-impact risk; our day-to-day actions are creating a small risk of destroying all of civilization and most life on Earth.

10. We can easily reduce atmospheric methane concentrations and  attendant warming; this is the good news.  Methane is not like CO2, which stays in the atmosphere for centuries.  No, methane is a “short-lived” gas.  On average, it stays in the atmosphere for less than ten years.  Many natural processes work to strip it out of the air.  Currently, human and natural sources emit about 558 million tonnes of methane per year, and natural processes in the atmosphere and soils remove all but 10 million tonnes.  (again, see Saunois et al.)  Despite our huge increase in methane production, sources and sinks are not that far out of balance.  Therefore, if we stop increasing our emissions then atmospheric concentrations could begin to fall.  We might see significant declines in just decades.  This isn’t the case for CO2, which will stay in the atmosphere for centuries.  But with methane, we have a real chance of reducing atmospheric levels and, as we do so, moderating warming and slowing climate change.

A series of policies focused on minimizing emissions from the fossil-fuel sector (banning venting and minimizing leaks from drilling and fracking and from pipes) could bring the rate of methane creation below the rate of removal and cause atmospheric levels to fall.  A more rational approach to meat production (including curbing over-consumption in North America and elsewhere) could further reduce emissions.  This is very promising news.  Methane reduction represents a “low-hanging fruit” when it comes to moderating climate change.

The methane problem is the climate problem in microcosm.  There are some relatively simple, affordable steps we can take now that will make a positive difference.  But, if we don’t act fast, aggressively, and effectively, we risk unleashing a whole range of effects that will swiftly move our climate into chaos and deprive humans of the possibility of limiting warming to manageable levels.  We can act to create some good news today, or we can suffer a world of bad news tomorrow.

Graph sources:
– United States Environmental Protection Agency (US EPA), “Climate Change Indicators: Atmospheric Concentrations of Greenhouse Gases.
– Commonwealth Scientific and Industrial Research Organisation (CSIRO), “Latest Cape Grim Greenhouse Gas Data.
– National Oceanic and Atmospheric Administration (NOAA), Earth System Research Laboratory, Global Monitoring Division, “Trends in Atmospheric Methane.

Electric car numbers, and projections to 2030

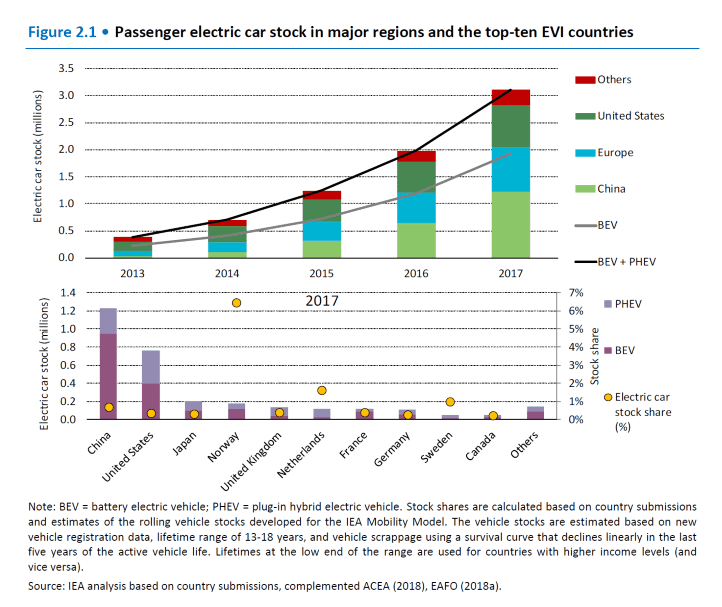
Graph of global electric vehicle numbers, 2013-17, and national data
Number of electric cars on the road, 2013 to 2017, and national data

In just two years, 2013 to 2015, the number of electric cars worldwide more than doubled.  And in the following two years, 2015 to 2017, the number more than doubled again, to just over 3 million.  This exponential growth means that electric vehicles (EVs)* will soon make up a large portion of the global car fleet.

This week’s graph is reprinted from Global EV Outlook 2018, the latest in a series of annual reports compiled by the International Energy Agency (IEA).

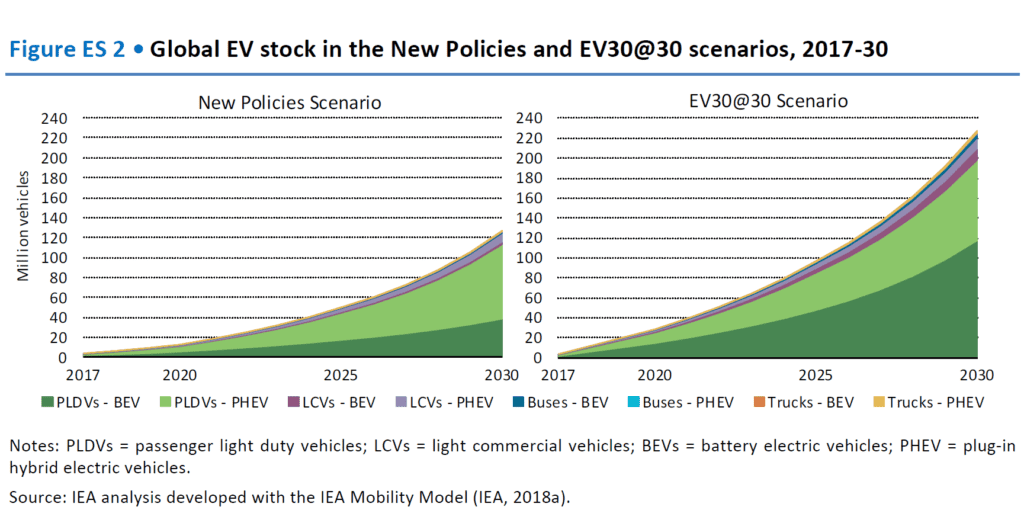
The graphs below show IEA projections of the number of EVs in the world by 2030 under two scenarios.  The first, the “New Policies Scenario,” takes into account existing and announced national policies.  Under this scenario, the number of EVs on the road is projected to reach 125 million by 2030.

The second scenario is called “EV30@30.”  This scenario is based on the assumption that governments will announce and implement new policies that will increase global EV penetration to 30 percent of new car sales by 2030—a 30 percent sales share.  This 30 percent share is roughly what is needed to begin to meet emission-reduction commitments made in the lead-up to the 2015 Paris climate talks.  Under this scenario, the number of EVs on the road could reach 228 million by 2030.

In either case, whether there are 125 million EV’s on the road in twelve years or 228 million, the result will be an impressive one, given that there were fewer than a million just four years ago.

Electric cars are not a panacea, but they do represent an important transition technology; electrifying much of the global car fleet can buy us the time we need to build zero-emission train and transit systems.  Thus, it is very important that we move very rapidly to maximize the number of EVs built and sold.  But the IEA is clear: EV adoption will depend on ambitious, effective government action.  The 228 million EVs projected under the EV30@30 Scenario will only exist if governments implement a suite of aggressive new policies.  The IEA states that:

“The uptake of electric vehicles is still largely driven by the policy environment.  The ten leading countries in electric vehicle adoption all have a range of policies in place to promote the uptake of electric cars.  Effective policy measures have proved instrumental in making electric vehicles more appealing to customers…, reducing risks for investors, and encouraging manufacturers to scale up production ….  Key examples of instruments employed by local and national governments to support EV deployment include public procurement programmes…, financial incentives to facilitate the acquisition of EVs and cut their usage cost (e.g. by offering free parking), and a variety of regulatory measures at different administrative levels, such as fuel-economy standards and restrictions on the circulation of vehicles based on tailpipe emissions performance.”

In 2018, about 95 million passenger cars and commercial vehicles were sold worldwide.  About 1 million were electric—about 1 percent.  The goal is to get to 30 percent in 12 years.  Attaining that goal, and thereby averting some of the worst effects of climate change, will require Herculean efforts by policymakers, regulators, international bodies, and automakers.

* There are two main types of EVs.  The first is plug-in hybrid electric vehicles (PHEVs).  These cars have batteries, can be plugged in, and can be driven a limited distance (usually tens of kilometres) using electrical power only, after which a conventional piston engine engages to charge the batteries or assist in propulsion.  Examples of PHEVs include the Chevrolet Volt and Toyota Prius Prime.  The second type is the battery electric vehicle (BEV).  BEVs have larger batteries, longer all-electric range (150 to 400 kms), and no internal combustion engines.  Examples of BEVs include the Chevrolet Bolt, Nissan Leaf, and several models from Tesla.  The term “electric vehicle” (EV) encompasses both PHEVs and BEVs.


We’re in year 30 of the current climate crisis

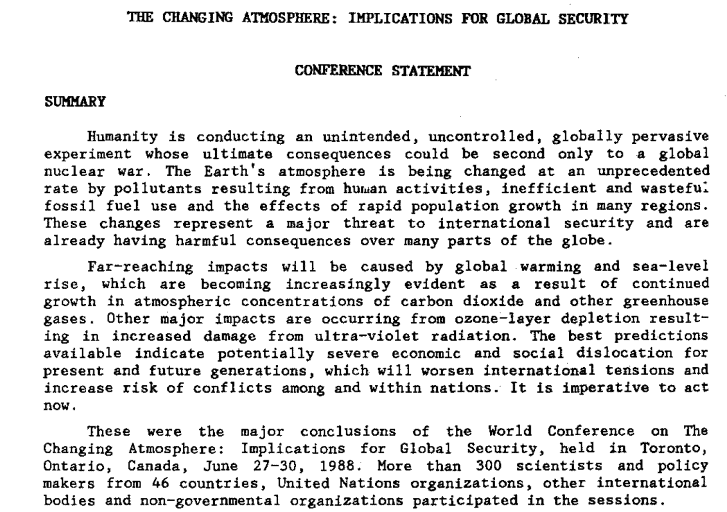
An excerpt from the Conference Statement of the 1988 World Conference on the Changing Atmosphere held in Toronto

In late-June, 1988, Canada hosted the world’s first large-scale climate conference that brought together scientists, experts, policymakers, elected officials, and the media.  The “World Conference on the Changing Atmosphere: Implications for Global Security” was held in Toronto, hosted by Canada’s Conservative government, and attended by hundreds of scientists and officials.

In their final conference statement, attendees wrote that “Humanity is conducting an unintended, uncontrolled, globally pervasive experiment whose ultimate consequences could be second only to a global nuclear war.”  (See excerpt pictured above.)  The 30-year-old conference statement contains a detailed catalogue of causes and effects of climate change.

Elizabeth May—who in 1988 was employed by Canada’s Department of Environment—attended the conference.   In a 2006 article she reflected on Canada’s leadership in the 1980s on climate and atmospheric issues:

“The conference … was a landmark event.  It was opened by Prime Minister Mulroney, who spoke then of the need for an international law of the atmosphere, citing our work on acid rain and ozone as the first planks in this growing area of international environmental governance…. 

Canada was acknowledged as the leader in hosting the first-ever international scientific conference on climate change, designed to give the issue a public face.  No nation would be surprised to see Canada in the lead.  After all, we had just successfully wrestled to the ground a huge regional problem, acid rain, and we had been champions of the Montreal Protocol to protect the ozone layer.”

The Toronto conference’s final statement also called on governments and industry to work together to “reduce CO2 emissions by approximately 20% … by the year 2005…. ”  This became known as the Toronto Target.  Ignoring that target and many others, Canada has increased its CO2 emissions by 29 percent since 1988.

Other events mark 1988 as the beginning of the modern climate-change era.  In 1988, governments and scientists came together to form the United Nations Intergovernmental Panel on Climate Change (IPCC). Since its formation, IPCC teams of thousands of scientists have worked to create five Assessment Reports which together total thousands of pages.

Also in 1988, NASA scientist Dr. James Hansen told a US congressional committee that climate change and global warming were already underway and that he was 99 percent certain that the cause was a buildup of carbon dioxide and other gases released by human activities.  Thirty years ago, Hansen told the committee that “It is time to stop waffling so much and say that the evidence is pretty strong that the greenhouse effect is here.” The New York Times and other papers gave prominent coverage to Hansen’s 1988 testimony.

Fast-forward to recent weeks.  Ironically, in Toronto, the site of the 1988 conference, and 30 years later, almost to the day, newly elected Ontario Premier Doug Ford announced he was scrapping Ontario’s carbon cap-and-trade emission-reduction plan, he vowed to push back against any federal-government moves to price or tax carbon, and he said he would join a legal challenge against the federal legislation.  In effect, Ford and premiers such as Saskatchewan’s Scott Moe have pledged to fight and stop Canada’s flagship climate change and emission-reduction initiative.  To do so, 30 years into the modern climate change era, is foolhardy, destructive, and unpardonable.

Citizens need to understand that when they vote for leaders such as Doug Ford (Ontario), Scott Moe (Saskatchewan), Jason Kenney (Alberta), or Andrew Scheer (federal Conservative leader) they are voting against climate action.  They are voting for higher emissions; runaway climate change; melting glaciers and permafrost; submerged seaports and cities worldwide; hundreds of millions of additional deaths from heat, floods, storms, and famines; and crop failures in this country and around the world.  A vote for a leader who promises inaction, slow action, or retrograde action is a vote to damage Canada and the Earth; it is a vote for economic devastation in the medium and long term, for dried-up rivers and scorched fields.  A vote for Moe, Ford, Kenney, Scheer, Trump, and a range of similar leaders is a vote to unleash biosphere-damaging and civilization-cracking forces upon our grandchildren, upon the natural environment, and upon the air, water, soil, and climate systems that support, provision, nourish, and enfold us.

In the 1990s, in decade one of the current climate crisis, inaction was excusable.  We didn’t know.  We weren’t sure.  We didn’t have the data.

As we enter decade four, inaction is tantamount to reckless endangerment—criminal negligence.  And retrograde action, such as that from Ford, Moe, Trump, and others, is tantamount to vandalism, arson, ecocide, and homicide.  How we vote and who we elect will affect how many forests burn, how many reefs disappear, and how many animals and people die.

In the aftermath of every crime against humanity (or against the planet or against the future) there are individuals who try to claim “I didn’t know.”  In year 30 of the current climate-change era, none can make that claim.  We’ve known for 30 years that the ultimate consequences of ongoing emissions and climate change “could be second only to a global nuclear war.”

Rail lines, not pipelines: the past, present, and future of Canadian passenger rail

Graph of Canadian railway network, kilometres, historic, 1836 to 2016
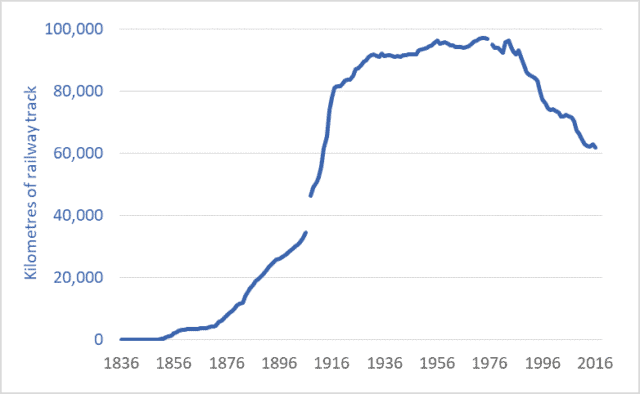
Canadian railway network, kilometres of track, 1836 to 2016

One kilometre of oil pipeline contains the same amount of steel as two kilometres of railway track.*  The proposed Trans Mountain pipeline expansion will, if it goes ahead, consume enough steel to build nearly 2,000 kms of new passenger rail track.  The Keystone XL project would consume enough steel to build nearly 4,000 kms of track.  And the now-cancelled Energy East pipeline would have required as much steel as 10,000 kms of track.  (For an overview of proposed pipelines, see this CAPP publication.)

With these facts in mind, Canadians (and Americans) should consider our options and priorities.  There’s tremendous pressure to build new pipelines.  Building them, proponents claim, will result in jobs and economic development.  But if we’re going to spend billions of dollars, lay down millions of tonnes of steel, and consume millions of person-hours of labour, should we be building soon-to-be-obsolete infrastructure to transport climate-destabilizing fossil fuels?  Or should we take the opportunity to create even more jobs building a zero-emission twenty-first century transportation network for Canada and North America?  Admittedly, the economics of passenger rail are different than those of pipelines; building a passenger rail system is not simply a matter of laying down steel rails.  But for reasons detailed below, limiting global warming probably makes significant investments in passenger rail inevitable.

The graph above shows the total length of the Canadian railway network.  The time-frame is the past 180 years: 1836 to 2016.  Between 1880 and 1918, Canada built nearly 70,000 kms of railway track—nearly 2,000 kms per year, using tools and machinery that were crude by modern standards, and at a time when the nation and its citizens were poor, compared to today.  In the middle and latter decades of the twentieth century, tens of thousands of kms of track were upgraded to accommodate heavier loads.

The length of track in the Canadian railway system peaked in the 1980s.  Recent decades have seen the network contract.  About a third of Canadian rail lines have been torn up and melted down over the past three-and-a-half decades.  Passenger rail utilization in recent years has fallen to levels not seen since the 1800s—down almost 90 percent from its 1940s peak, despite a doubling of the Canadian population.  Indeed, ridership on Via Rail is half of what it was as recently as 1989.

Contrast China.  In just one decade, that nation has built 25,000 miles of high-speed passenger rail lines.  Trains routinely operate at speeds in excess of 300 km/h.  Many of those trains were designed and built by Canada’s Bombardier.  China plans to build an additional 13,000 kms of high-speed passenger lines in the next seven years.

Japan’s “bullet trains” began running more than 50 years ago.  The Japanese high-speed rail network now exceeds 2,700 kms, with trains reaching speeds of 320 km/h.

Saudi Arabia, Poland, Turkey, and Morocco all have high-speed lines, as do more than a dozen nations in Europe.  Uzbekistan—with a GDP one-twentieth that of Canada’s—has built 600 kms of high-speed rail line and has trains operating at 250 km/h.

The construction of Canadian and North American passenger rail networks is probably inevitable.  As part of an international effort to hold global temperature increases below 2 degrees C, Canada has committed to reduce greenhouse gas (GHG) emissions emission by 30 percent by 2030—now less than 12 years away.  Emissions reductions must continue after 2030, reaching 50 to 60 percent in little more than a generation.  Emission reductions of this magnitude require an end to routine air travel.  Aircraft may still be needed for trans-oceanic travel, but within continents long-distance travel will have to take place using zero-emission vehicles: electric cars or buses for shorter journeys, and electrified passenger trains for longer ones.

This isn’t bad news.  Trains can transport passengers from city-centre to city-centre, eliminating long drives to and from airports.  Trains do not require time-consuming airport security screenings.  These factors, combined with high speeds, mean that for many trips, the total travel time is less for trains than for planes.  And because trains have more leg-room and often include observation cars, restaurants, and lounges, they are much more comfortable, enjoyable, and social.  For some long journeys where it is not cost-effective to build high-speed rail lines, European-style sleeper trains can provide comfortable, convenient overnight transport.  In other cases, medium-speed trains (traveling 150 to 200 km/h) may be the most cost-effective option.

Canada must embrace the inevitable: air travel must be cut by 90 percent; and fast, comfortable, zero-emission trains must take the place of the planes.  Maybe we can build thousands of kms of passenger rail lines and thousands of kms of pipelines.  But given the gravity and menace of the climate crisis and given the rapidly approaching deadlines to meet our emission-reduction commitments, it isn’t hard to see which should be our priority.


*For example, Kinder Morgan’s Trans Mountain pipeline would be made up primarily of 36” pipe (914mm) with a 0.465 wall thickness (11.8 mm).  This pipe weighs 262 kgs/m.  Rails for high-speed trains and other demanding applications often weigh 60 kgs/m.  As two rails are needed, this means 120 kgs/m—half the weight of a comparable length of pipeline.

Graph sources:
Urquhart and Buckley, 1965, Historical Statistics of Canada.
Leacy, Urquhart, and Buckley, 1983, Historical Statistics of Canada, 2nd Ed.
Stats. Can., Various years, Railway Transport in Canada: General Statistics.
Stats. Can., CANSIM Table 404-0010


Will Trump’s America crash Earth’s climate?

Graph of US energy consumption by fuel, 1990 to 2050
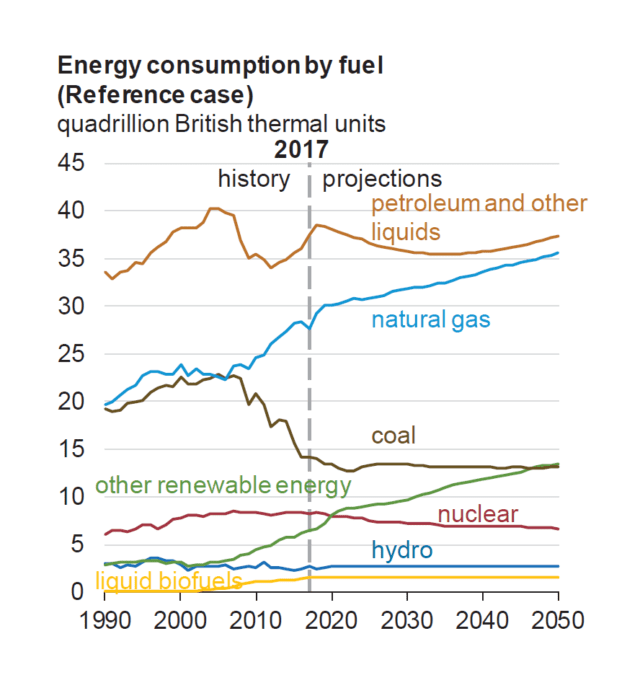
US energy consumption by fuel, 1990 to 2050

Last week, the US Department of Energy (DOE) released its annual report projecting future US energy production and consumption and greenhouse gas (GHG) emissions.  This year’s report, entitled Annual Energy Outlook 2018, with Projections to 2050 forecasts a nightmare scenario of increasing fossil fuel use, increasing emissions, lackluster adoption of renewable energy options, and a failure to shift to electric vehicles, even by mid-century.

The graph above is copied from that DOE report.  The graph shows past and projected US energy consumption by fuel type.  The top line shows “petroleum and other liquids.”  This is predominantly crude oil products, with a minor contribution from “natural gas liquids.”  For our purposes, we can think of it as representing liquid fuels used in cars, trucks, planes, trains, and ships.  Note how the US DOE is projecting that in 2050 America’s consumption of these high-emission fuels will be approximately equal to levels today.

The next line down is natural gas.  This is used mostly for heating and for electricity generation.  Note how the DOE is projecting that consumption (i.e., combustion) of natural gas will be about one-third higher in 2050 than today.

Perhaps worst of all, coal combustion will be almost as high in 2050 as it is today.   No surprise, the DOE report (page 15) projects that US GHG emissions will be higher in 2050 than today.

Consumption of renewable energy will rise.  The DOE is projecting that in 2050 “other renewables”—essentially electricity from solar photovoltaic panels and wind turbines—will provide twice as much power as today.  But that will be only a fraction of the energy supplied by fossil fuels: oil, natural gas, and coal.

How can this be?  The world’s nations have committed, in Paris and elsewhere, to slash emissions by mid-century.  To keep global temperature increases below 2 degrees Celsius, industrial nations will have to cut emissions by half by 2050.  So what’s going on in America?

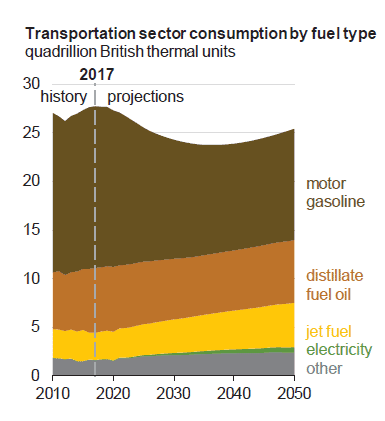
The DOE projections reveal that America’s most senior energy analysts and policymakers believe that US policies currently in place will fail to curb fossil fuel use and reduce GHG emissions.  The DOE report predicts, for example, that in 2050 electric vehicles will make up just a small fraction of the US auto fleet.  See the graph below.  Look closely and you’ll see the small green wedge representing electrical energy use in the transportation sector.  The graph also shows that the the consumption of fossil fuels—motor gasoline, diesel fuel, fuel oil, and jet fuel—will be nearly as high in 2050 as it is now.  This is important: The latest data from the top experts in the US government predict that, given current policies, the transition to electric vehicles will not happen.

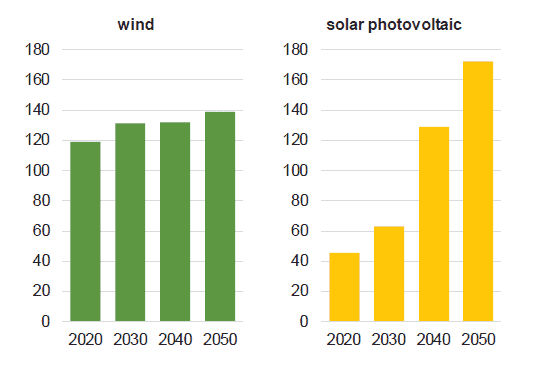
The next graph, below, shows that electricity production from solar arrays will increase significantly.  But the projection is that the US will not install significant numbers of wind turbines, so long as current policies remain in force and current market conditions prevail.

The report projects (page 84) that in 2050 electricity generation from the combustion of coal and natural gas will be twice as high as generation from wind turbines and solar panels.

Clearly, this is all just a set of projections.  The citizens and governments of the United States can change this future.  And they probably will.  They can implement policies that dramatically accelerate the transition to electric cars, electric trains, energy-efficient buildings, and low-emission renewable energy.

But the point of this DOE report (and the point of this blog post) is that such policies are not yet in place.  In effect, the US DOE report should serve as a warning: continue as now and the US misses its emissions reduction commitments by miles, the Earth probably warms by 3 degrees or more, and we risk setting off a number of global climate feedbacks that could render huge swaths of the planet uninhabitable and kill hundreds of millions of people this century.

The house is on fire.  We can put it out.  But the US Department of Energy is telling us that, as of now, there are no effective plans to do so.

Perhaps step one is to remove the arsonist-in-chief.