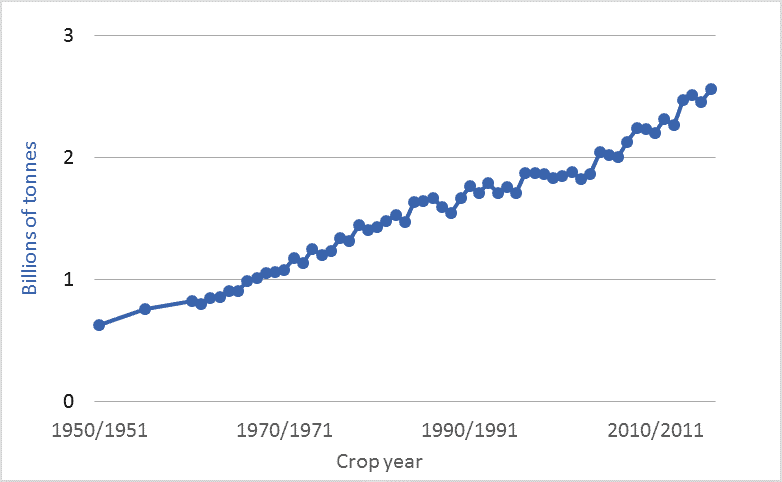
This blog post and the next (Turning fossil fuels into … food) look at the rapid expansion of our global food supply and how we’ve accomplished that feat. The graph above shows world grain production for the past 66 years: 1950 to 2016. The units are billions of tonnes of annual production of all grains: primarily wheat, corn, rice, barley, oats, and millet. The figures exclude oilseeds, tonnage of which is about one-fifth as large as that of grains.
By utilizing ever-increasing inputs of water, machinery, fuels, chemicals, technologically-enhanced seeds, and, especially, fertilizers, the world’s farmers have managed to quadruple global grain production since 1950, and to double production since 1975. This expansion has been accomplished on a largely unchanged land area. Farmers have doubled output since the mid-’70s on a cropland area that, according to the UN’s Food and Agriculture Organization (FAO), has increased by just 5 percent.
The UN projects that global human population will increase by 50 percent by the end of this century, to 11.2 billion. That enlarged population will likely be richer, on average, than today’s population. Thus, per-capita meat demand will probably rise. When we feed grains to livestock, we turn 5 to 10 grain Calories into 1 meat Calorie. Thus, diets rich in meat require higher levels of grain production. Coming on top of these drivers of increased grain consumption is the likely increase in demand for biofuels, biomass, and feedstocks for “the bioeconomy.” The Global Harvest Initiative is an industry group whose members include John Deere, Monsanto, Mosaic, and Dupont. The group asserts that there is a “Global Agricultural Imperative” to “nearly double global agricultural output by 2050 to respond to a rapidly growing population and to meet the consumer demands of an expanding middle class.” If this doubling is accomplished, it will mark an 8-fold increase over 1950 production levels. Few citizens or policymakers are aware that the bounty in our supermarkets and on our tables depends upon very rapid and difficult-to-sustain rates of growth in food production.
Graph sources: 1960-2016: United States Department of Agriculture (USDA) World Agricultural Supply and Demand Estimates (WASDE), ; 1950 and 1955: Lester Brown and Worldwatch Institute, various publications. Brown and Worldwatch cite USDA, “World Grain Database,” unpublished printout, 1991.

