Another trillion tonnes: 250 years of global material use data

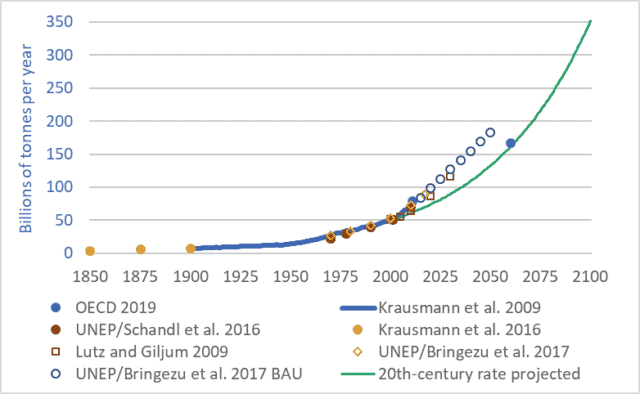
Graph of Global materials use 1850-2100
Global materials use, 1850-2100

Want to understand your society and economy and the fate of petro-industrial civilization?  If so, don’t “follow the money.”  The stock market casino, quantitative easing, derivatives and other “financial innovations,” and the trillions of e-dollars that flit through the global monetary system each day obscure the real economy—the production and destruction of actual wealth: mining, farming, processing, transport, manufacturing, consumption, disposal.  To understand where we are and where we may be going, we must follow more tangible flows—things that are real.  We must follow the oil, coal, steel, concrete, grain, copper, fertilizers, salt, gravel, and other materials.

Our cars, homes, phones, foods, fuels, clothes, and all the other products we consume or aspire to are made out of stuff—out of materials, out of wood, iron, cotton, etc.   And our economies consume enormous quantities of those materials—tens-of-billions of tonnes per year.

The graph above shows 250 years of actual and projected material flows through our global economy.  The graph may initially appear complicated, because it brings together seven different sources and datasets and includes a projection to the year 2100.  But the details of the graph aren’t important.  What is important is the overall shape: the ever-steepening upward trendline—the exponential growth.

In 1900, global material flows totalled approximately 7 billion tonnes.  The technical term for these material flows is “utilized materials”—the stuff we dig out of mines, pump up from oil or natural gas wells, cut down in forests, grow on farms, catch from the sea, dig out of quarries, and otherwise appropriate for human uses.  These tonnages do not include water, nor do they include unused overburden, but they do include mine tailings, though this last category adds just a few percent to the total.

Between 1900 and 2000, global material tonnage increased sevenfold—to approximately 49 billion tonnes (Krausman et al. 2009).  Tonnage rose to approx. 70 billion tonnes by 2010 (UNEP/Schandl 2016), and to approx. 90 billion tonnes by 2018 (UNEP/Bringezu 2018).  At the heart of our petro-industrial consumerist civilization is a network of globe-spanning conveyors that, each second, extract and propel nearly 3,000 tonnes of materials from Earth’s surface and subsurface to factories, cities, shops, and homes, and eventually on to landfills, rivers and oceans, and the atmosphere.  At a rate of a quarter-billion tonnes per day we’re turning the Earth and biosphere into cities, homes, products, indulgences, and fleeting satisfactions; and emissions, by-products, toxins, and garbage.

And these extraction, consumption, and disposal rates are projected to continue rising—to double every 30 to 40 years (Lutz and Giljum 2009).  Just as we increased material use sevenfold during the 20th century we’re on track to multiply it sevenfold during the 21st.  If we maintain the “normal” economic growth rates of the 20th century through the 21st we will almost certainly increase the volume and mass of our extraction, production, and disposal sevenfold by 2100.

But 2100 is a long way away.  Anything could happen by then.  Granted.  So let’s leave aside the long-term and look only at the coming decade.  Material throughput now totals about 90 billion tonnes per year, and is projected to rise to about 120 billion tonnes per year over the coming decade.  For ease of math, let’s say that the average over the coming decade will be 100 billion tonnes per year.  That means that between 2019 and 2029 we will extract from within the Earth and from the biosphere one trillion tonnes of materials: coal, oil, wood, fish, nickel, aluminum, chromium, uranium, etc.  …one trillion tonnes.  And we’ll send most of that trillion tonnes on into disposal in the ground, air, or water—into landfills, skyfills, and seafills.  In the coming decade, when you hear ever-more-frequent reports of the oceans filling with plastic and the atmosphere filling with carbon, think of that trillion tonnes.

Postscript: “dematerialization”

At conferences and in the media there’s a lot of talk of “dematerialization,” and its cousin “decarbonization.”  The idea is this: creating a dollar of economic activity used to require X units of energy or materials, but now, in countries such as Canada and the United States, creating a dollar of economic activity requires only two-thirds-X units.  Pundits and officials would have us believe that, because efficiency is increasing and less material and energy are needed per dollar, the economy is being “dematerialized.”  They attempt to show that the economy can grow and grow but we need not use more materials or energy.  Instead of consuming heavy steel cars, we will consume apps, massages, and manicures.  But this argument is wrong.  Global material and energy use increased manyfold during the 20th century.  The increases continue.  A business-as-usual scenario will see energy and materials use double every 30 to 40 years.  And just because the sizes of our economies, measured in abstract currencies, are growing faster, this does not change the fact that our use of energy and materials is growing.  “Dematerialization” has no useful meaning in a global economy in which we are using 90 billion tonnes of materials per year and projecting the use of 180 billion tonnes by 2050.  Our rate of extraction and consumption of materials is rising; the fact that the volume of dollar flows is rising faster is merely a distraction.

Sources for material flow tonnage:

Fridolin Krausmann et al., “Growth in Global Materials Use, GDP, and Population During the 20th Century,” Ecological Economics 68, no. 10 (2009).

Christian Lutz and Stefan Giljum, “Global Resource Use in a Business-as-Usual World: Updated Results from the GINFORS Model,” in Sustainable Growth and Resource Productivity: Economic and Global Policy Issues, ed. Bleischwitz et al. (Sheffield, UK: Greenleaf Publishing, 2009).

Stefan Giljum et al., Sustainable Europe Research Institute (SERI), “Resource Efficiency for Sustainable Growth: Global Trends and European Policy Scenarios,” background paper, delivered Sept. 10, 2009, in Manila, Philippines.

Julia Steinberger et al., “Global Patterns of Materials Use: A Socioeconomic and Geophysical Analysis,” Ecological Economics 69, no. 5 (2010).

UN Environmental Programme (UNEP) and H. Schandl et al., Global Material Flows and Resource Productivity: An Assessment Study of the UNEP International Resource Panel (Paris: UNEP, 2016).

Krausmann et al., “Long-term Trends in Global Material and Energy Use,” in Social Ecology: Society-Nature Relations across Time and Space, ed. Haberl et al. (Switzerland: Springer, 2016).

United Nations Environment Programme (UNEP), International Resource Panel, and Stefan Bringezu et al., Assessing Global Resource Use: A Systems Approach to Resource Efficiency and Pollution Reduction (Nairobi: UNEP, 2017).

Organization for Economic Cooperation and Development (OECD), Global Material Resources Outlook to 2060: Economic Drivers and Environmental Consequences (Paris: OECD Publishing, 2019)

Some good news on climate change

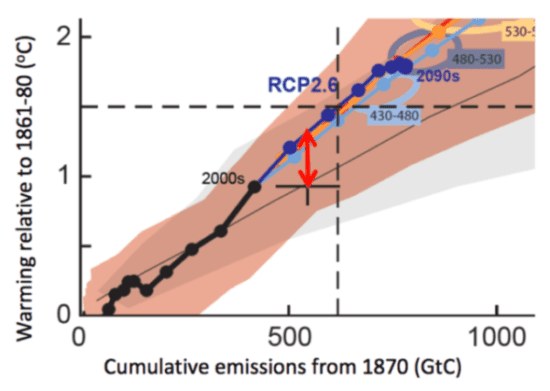
Graph adapted from Millar et al.
A graph produced by Millar et al. illustrating their re-assessment of carbon budgets.

A September 18th article in the journal Nature Geoscience provides some good news in the struggle to save human civilization (and perhaps half the planet’s species) from the ravages of climate change.  The article by Richard Millar and nine colleagues calculates that there is still time to hold global temperature rise to 1.5 degrees Celsius above pre-industrial temperatures.  (Article link is here.)

A 1.5 degree target was set in Paris in 2015.  While many people assert that holding temperature increases to 1.5 degrees is impossible, Millar et al. reassess carbon budgets to show that the target is attainable.  By their calculations, humans can emit an additional 700 to 900 billion tonnes of CO2 and still have a 66% chance of holding temperature increases below 1.5 degrees.  That amount of CO2 is approximately equal to 20 years of emissions at current rates.  (Previous assessments indicated that the carbon budget for 1.5 degrees would be used up in 5 to 7 years at current emission rates.)

The findings in the Millar paper are good news.  Here’s why: they take away the argument that “it’s too late.”  We still have it within our power to hold temperature increases below dangerous levels, spare low-lying island nations, prevent the inundation of rich river-delta agricultural lands in Bangladesh and elsewhere, retain the Greenland ice sheet, and prevent the worst ravages of climate change.  Here’s the message everyone should hear: It’s not too late.

But while it’s not too late, it is late.  The other message people should take from this article is that we have no time to spare.  Aggressive action is necessary now.  If we are to save ourselves from ourselves we must embark on a mobilization of near-wartime scale and speed to transform the global economy and its energy and transportation systems.  We need government-led mobilization for transformation.

The article’s lead author, Richard Millar, wrote a commentary stating that “the window for achieving 1.5C is still narrowly open.  If very aggressive mitigation scenarios can be implemented from today onwards, they may be sufficient to achieve the goals of the Paris Agreement.”  (Find that commentary here.)  At a press event he stated that holding increases to 1.5 degrees requires “starting reductions immediately and then reducing emissions to zero over 40 years.”  Like nearly everyone else who has looked at this issue, Millar and his team have concluded that emissions reductions must begin immediately and emissions from the global economy must be reduced to zero by the 2050s or 2060s.

So here’s where we are: Millar et al. calculate that we have the time (if only just).  We have the technologies: solar panels, wind turbines, electric trains, net-zero and passive solar homes.  We have historical examples of action on a similar scale: the WWII repurposing of the major industrial economies.  And we have the productive capacity: a global manufacturing sector of unprecedented scale and output.  Civilian and military aircraft makers must be compelled to immediately begin building trains.  Auto makers must build electric cars.  The home renovation industry must be redirected away from fantasy kitchens and home spas and toward energy-efficiency retrofits.  And electrical utilities must rapidly replace GHG-emitting generation plants with near-zero-emission alternatives.  And we must do all these things at rates that reflect that our future depends upon our success.

The calculations by Millar et al. are sure to be controversial and closely examined.  They may be revised.  But the paper has weight because the team that wrote it includes many of the leading experts on carbon budgets.  As climate scientist Glen Peter notes here: “the authors of this paper developed the idea of carbon budgets, are the world leading experts on carbon budgets, and derived the carbon budgets for the IPCC process.”  We should all hope that Millar and his colleagues are correct in their reassessment.

The graph above is taken from a commentary by Millar and adapted from the article by Millar et al.  (Link to the commentary here.)

Efficiency, the Jevons Paradox, and the limits to economic growth

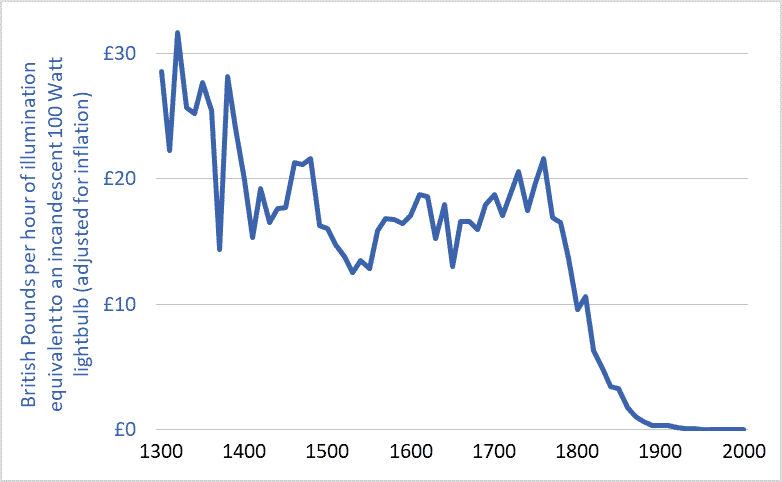
Graph of the cost of lighting in the UK, 1300-2000

I’ve been thinking about efficiency.  Efficiency talk is everywhere.  Car buyers can purchase ever more fuel-efficient cars.  LED lightbulbs achieve unprecedented efficiencies in turning electricity into visible light.  Solar panels are more efficient each year.  Farmers are urged toward fertilizer-use efficiency.  And our Energy Star appliances are the most efficient ever, as are the furnaces and air conditioners in many homes.

The implication of all this talk and technology is that efficiency can play a large role in solving our environmental problems.  Citizens are encouraged to adopt a positive, uncritical, and unsophisticated view of efficiency: we’ll just make things more efficient and that will enable us to reduce resource use, waste, and emissions, to solve our problems, and to pave the way for “green growth” and “sustainable development.”

But there’s something wrong with this efficiency solution: it’s not working.  The current environmental multi-crisis (depletion, extinction, climate destabilization, ocean acidification, plastics pollution, etc.) is not occurring as a result of some failure to achieve large efficiency gains.  The opposite.  It is occurring after a century of stupendous and transformative gains.  Indeed, the efficiencies of most civilizational processes (e.g., hydroelectric power generation, electrical heating and lighting, nitrogen fertilizer synthesis, etc.) have increased by so much that they are now nearing their absolute limits—their thermodynamic maxima.  For example, engineers have made the large electric motors that power factories and mines exquisitely efficient; those motors turn 90 to 97 percent of the energy in electricity into usable shaft power.  We have maximized efficiencies in many areas, and yet our environmental problems are also at a maximum.  What gives?

There are many reasons why efficiency is not delivering the benefits and solutions we’ve been led to expect.  One is the “Jevons Paradox.”  That Paradox predicts that, as the efficiencies of energy converters increase—as cars, planes, or lightbulbs become more efficient—the cost of using these vehicles, products, and technologies falls, and those falling costs spur increases in use that often overwhelm any resource-conservation gains we might reap from increasing efficiencies.  Jevons tells us that energy efficiency often leads to more energy use, not less.  If our cars are very fuel efficient and our operating costs therefore low, we may drive more, more people may drive, and our cities may sprawl outward so that we must drive further to work and shop.  We get more miles per gallon, or per dollar, so we drive more miles and use more gallons.  The Jevons Paradox is a very important concept to know if you’re trying to understand our world and analyze our situation.

The graph above helps illustrate the Jevons Paradox.  It shows the cost of a unit of artificial light (one hour of illumination equivalent to a modern 100 Watt incandescent lightbulb) in England over the past 700 years.  The currency units are British Pounds, adjusted for inflation.  The dramatic decline in costs reflects equally dramatic increases in efficiency.

Adjusted for inflation, lighting in the UK was more than 100 times more affordable in 2000 than in 1900 and 3,000 time more affordable than in 1800.  Stated another way, because electrical power plants have become more efficient (and thus electricity has become cheaper), and because new lighting technologies have become more efficient and produce more usable light per unit of energy, an hour’s pay for the average worker today buys about 100 times more artificial light than it did a century ago and 3,000 time more than two centuries ago.

But does all this efficiency mean that we’re using less energy for lighting?  No.  Falling costs have spurred huge increases in demand and use.  For example, the average UK resident in the year 2000 consumed 75 times more artificial light than did his or her ancestor in 1900 and more than 6,000 times more than in 1800 (Fouquet and Pearson).  Much of this increase was in the form of outdoor lighting of streets and buildings.  Jevons was right: large increases in efficiency have meant large decreases in costs and large increases in lighting demand and energy consumption.

Another example of the Jevons Paradox is provided by passenger planes.  Between 1960 and 2016, the per-seat fuel efficiency of jet airliners tripled or quadrupled (IPCC).  This, in turn, helped lower the cost of flying by more than 60%.  A combination of lower airfares, increasing incomes, and a growing population has driven a 50-fold increase in global annual air travel since 1960—from 0.14 trillion passenger-kilometres per year to nearly 7 trillion (see here for more on the exponential growth in air travel).  Airliners have become three or four times more fuel efficient, yet we’re now burning seventeen times more fuel.  William Stanley Jevons was right.

One final point about efficiency.  “Efficiency” talk serves an important role in our society and economy: it licenses growth.  The idea of efficiency allows most people to believe that we can double and quadruple the size of the global economy and still reduce energy use and waste production and resource depletion.  Efficiency is one of our civilization’s most important licensing myths.  The concept of efficiency-without-limit has been deployed to green-light the project of growth-without-end.

Graph sources: Roger Fouquet, Heat Power and Light: Revolutions in Energy Services