Another trillion tonnes: 250 years of global material use data

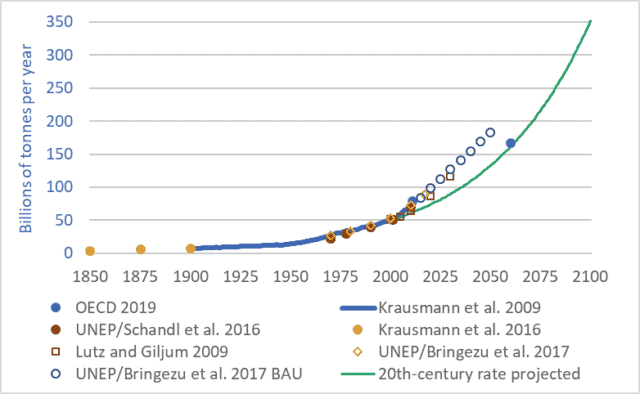
Graph of Global materials use 1850-2100
Global materials use, 1850-2100

Want to understand your society and economy and the fate of petro-industrial civilization?  If so, don’t “follow the money.”  The stock market casino, quantitative easing, derivatives and other “financial innovations,” and the trillions of e-dollars that flit through the global monetary system each day obscure the real economy—the production and destruction of actual wealth: mining, farming, processing, transport, manufacturing, consumption, disposal.  To understand where we are and where we may be going, we must follow more tangible flows—things that are real.  We must follow the oil, coal, steel, concrete, grain, copper, fertilizers, salt, gravel, and other materials.

Our cars, homes, phones, foods, fuels, clothes, and all the other products we consume or aspire to are made out of stuff—out of materials, out of wood, iron, cotton, etc.   And our economies consume enormous quantities of those materials—tens-of-billions of tonnes per year.

The graph above shows 250 years of actual and projected material flows through our global economy.  The graph may initially appear complicated, because it brings together seven different sources and datasets and includes a projection to the year 2100.  But the details of the graph aren’t important.  What is important is the overall shape: the ever-steepening upward trendline—the exponential growth.

In 1900, global material flows totalled approximately 7 billion tonnes.  The technical term for these material flows is “utilized materials”—the stuff we dig out of mines, pump up from oil or natural gas wells, cut down in forests, grow on farms, catch from the sea, dig out of quarries, and otherwise appropriate for human uses.  These tonnages do not include water, nor do they include unused overburden, but they do include mine tailings, though this last category adds just a few percent to the total.

Between 1900 and 2000, global material tonnage increased sevenfold—to approximately 49 billion tonnes (Krausman et al. 2009).  Tonnage rose to approx. 70 billion tonnes by 2010 (UNEP/Schandl 2016), and to approx. 90 billion tonnes by 2018 (UNEP/Bringezu 2018).  At the heart of our petro-industrial consumerist civilization is a network of globe-spanning conveyors that, each second, extract and propel nearly 3,000 tonnes of materials from Earth’s surface and subsurface to factories, cities, shops, and homes, and eventually on to landfills, rivers and oceans, and the atmosphere.  At a rate of a quarter-billion tonnes per day we’re turning the Earth and biosphere into cities, homes, products, indulgences, and fleeting satisfactions; and emissions, by-products, toxins, and garbage.

And these extraction, consumption, and disposal rates are projected to continue rising—to double every 30 to 40 years (Lutz and Giljum 2009).  Just as we increased material use sevenfold during the 20th century we’re on track to multiply it sevenfold during the 21st.  If we maintain the “normal” economic growth rates of the 20th century through the 21st we will almost certainly increase the volume and mass of our extraction, production, and disposal sevenfold by 2100.

But 2100 is a long way away.  Anything could happen by then.  Granted.  So let’s leave aside the long-term and look only at the coming decade.  Material throughput now totals about 90 billion tonnes per year, and is projected to rise to about 120 billion tonnes per year over the coming decade.  For ease of math, let’s say that the average over the coming decade will be 100 billion tonnes per year.  That means that between 2019 and 2029 we will extract from within the Earth and from the biosphere one trillion tonnes of materials: coal, oil, wood, fish, nickel, aluminum, chromium, uranium, etc.  …one trillion tonnes.  And we’ll send most of that trillion tonnes on into disposal in the ground, air, or water—into landfills, skyfills, and seafills.  In the coming decade, when you hear ever-more-frequent reports of the oceans filling with plastic and the atmosphere filling with carbon, think of that trillion tonnes.

Postscript: “dematerialization”

At conferences and in the media there’s a lot of talk of “dematerialization,” and its cousin “decarbonization.”  The idea is this: creating a dollar of economic activity used to require X units of energy or materials, but now, in countries such as Canada and the United States, creating a dollar of economic activity requires only two-thirds-X units.  Pundits and officials would have us believe that, because efficiency is increasing and less material and energy are needed per dollar, the economy is being “dematerialized.”  They attempt to show that the economy can grow and grow but we need not use more materials or energy.  Instead of consuming heavy steel cars, we will consume apps, massages, and manicures.  But this argument is wrong.  Global material and energy use increased manyfold during the 20th century.  The increases continue.  A business-as-usual scenario will see energy and materials use double every 30 to 40 years.  And just because the sizes of our economies, measured in abstract currencies, are growing faster, this does not change the fact that our use of energy and materials is growing.  “Dematerialization” has no useful meaning in a global economy in which we are using 90 billion tonnes of materials per year and projecting the use of 180 billion tonnes by 2050.  Our rate of extraction and consumption of materials is rising; the fact that the volume of dollar flows is rising faster is merely a distraction.

Sources for material flow tonnage:

Fridolin Krausmann et al., “Growth in Global Materials Use, GDP, and Population During the 20th Century,” Ecological Economics 68, no. 10 (2009).

Christian Lutz and Stefan Giljum, “Global Resource Use in a Business-as-Usual World: Updated Results from the GINFORS Model,” in Sustainable Growth and Resource Productivity: Economic and Global Policy Issues, ed. Bleischwitz et al. (Sheffield, UK: Greenleaf Publishing, 2009).

Stefan Giljum et al., Sustainable Europe Research Institute (SERI), “Resource Efficiency for Sustainable Growth: Global Trends and European Policy Scenarios,” background paper, delivered Sept. 10, 2009, in Manila, Philippines.

Julia Steinberger et al., “Global Patterns of Materials Use: A Socioeconomic and Geophysical Analysis,” Ecological Economics 69, no. 5 (2010).

UN Environmental Programme (UNEP) and H. Schandl et al., Global Material Flows and Resource Productivity: An Assessment Study of the UNEP International Resource Panel (Paris: UNEP, 2016).

Krausmann et al., “Long-term Trends in Global Material and Energy Use,” in Social Ecology: Society-Nature Relations across Time and Space, ed. Haberl et al. (Switzerland: Springer, 2016).

United Nations Environment Programme (UNEP), International Resource Panel, and Stefan Bringezu et al., Assessing Global Resource Use: A Systems Approach to Resource Efficiency and Pollution Reduction (Nairobi: UNEP, 2017).

Organization for Economic Cooperation and Development (OECD), Global Material Resources Outlook to 2060: Economic Drivers and Environmental Consequences (Paris: OECD Publishing, 2019)

Energy slaves, “hard work,” and the real sources of wealth

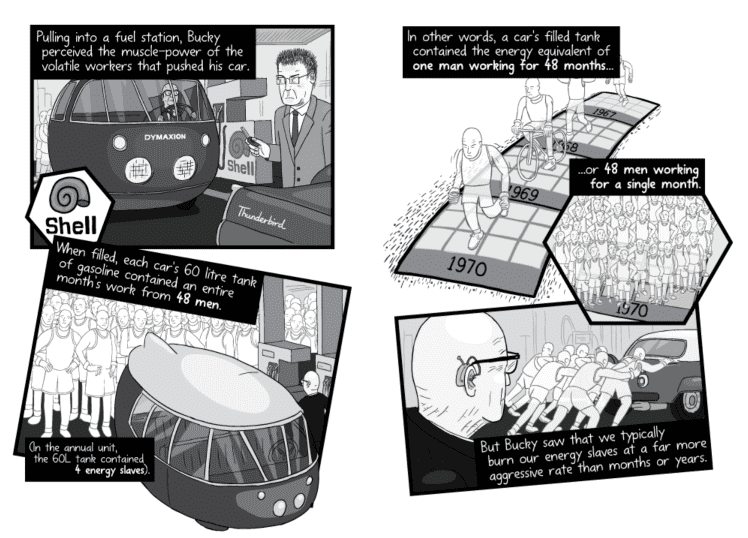
Stuart McMillen graphic novel Energy Slaves
An excerpt from the online long-form comic "Energy Slaves" by Stuart McMillen

Check out this brilliant ‘long-form comic’ by Stuart McMillen: Energy Slaves.  Click here or on the URL above.

Many Canadians and Americans struggle financially.  Millions are unemployed.  Many others live paycheque-to-paycheque.  A 2017 report by the US Federal Reserve Board found that 40 percent of US citizens couldn’t cover an unexpected expense of $400 without selling something or borrowing money.  There’s a lot of denial and misunderstanding regarding the financial challenges faced by a large portion of our fellow citizens.

Equally, though, there is misunderstanding, denial, and myth-making regarding those among us who are more financially secure, those who are well off—“the rich.”  Most glaring is the way we mischaracterize the sources of our wealth, luxury, and ease.  We lie to ourselves and each other regarding why we have it so good.  The rich often claim that their wealth is a result of “hard work.”  We hear people objecting to even the smallest tax increase, saying: “I worked hard for my money and no one is going to take it from me.”

The reality, however, is quite the opposite.  The rich don’t work very hard.  Every poor women or girl in Asia or Africa who gets up at dawn to walk many kilometres to carry home water or firewood for her family works harder than the world’s multi-millionaires and billionaires.  Every farmer with a hoe or toiling behind an oxen works harder than any CEO.  My farmer grandparents worked far harder than I do, yet I live much better.  I would be self-delusional in the extreme to attribute my middle-class luxury to “hard work.”

No, those of us in North America, the European Union, and elsewhere in the world who enjoy privileged lives live well, not because we work hard, but because of the vast energy windfall of which we are the beneficiaries.  We live lives of comfort and ease because our work is done for us by “energy slaves.”

A human worker can toil at a constant rate of about one-tenth horsepower.  Working hard all year at that rate I can do about 200 horsepower-hours worth of work—hoeing or hauling or digging.  But if I add up the work accomplished by non-human energy—by fossil fuels and machines and by electricity from various sources and electric motors—I find that, on a per-capita average, that quantity is 100 times my annual work output.  For every unit of work I do, the motors and machines that surround me do 100 units.  Those of us who live comfortable, high-consumption lives are subsidized 100-to-1 by work we do not do.  And the richest among us enjoy the largest of those subsidies.

Let me state that another way: If I look around me, at the hurtling cars and trucks, the massive quantities of cloth and steel and concrete created each year, the rapidly expanding cities, the roads that get paved and the bridges built, I am seeing a quantity of building and digging and hauling and making that is 100 times greater than the humans around me could accomplish.  Human muscles and energies provide one percent of the work needed to create and maintain our towering, hyper-productive, petro-industrial civilization; but electricity, fossil fuels, other energy sources, engines, and machines provide the other 99 percent.  We and our human bodies put in 1 unit of work, but enjoy the benefits of 100.  That is the reason so many of us live better than the kings, sultans, and emperors of previous centuries.

As Stuart McMillen brilliantly illustrates in his long-form comic, Energy Slaves, it is as if each of us has a whole troupe of slaves toiling for our benefit.  It is the work of these virtual assistants that propel us along, create our homes and cities, raise our food, pump our water,  and make our goods.

We will face many hard questions as we progress through the twenty-first century: can we continue to consume energy at the rates we do now?  How can we generate that energy without fouling the atmosphere and destabilizing the climate?  How do we more equitably share access to energy among our soon-to-be 11-billion-person population?  How do we address energy poverty?  And all these questions and issues are tied to others, such as to issues of income inequality.  But a vital first step is to begin to talk honestly about the real sources of our wealth, to acknowledge that we enjoy undeserved subsidies, to admit that we are all (energy) lottery winners, and to approach the future with attitudes of humility and gratitude rather than entitlement.  We cannot navigate the future if we cling to the self-serving and self-aggrandizing myths of the past.

Civilization as asteroid: humans, livestock, and extinctions

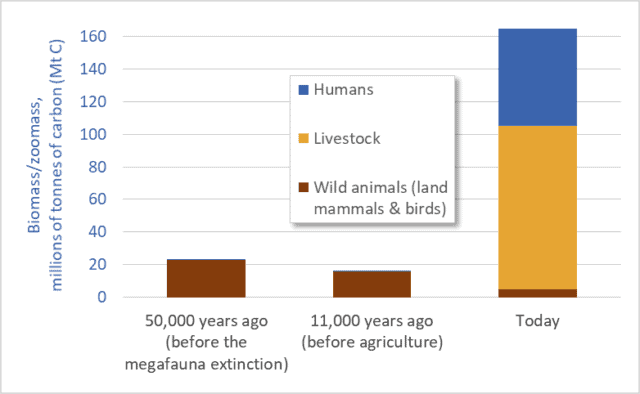
Graph of biomass of humans, livestock, and wild animals
Mass of humans, livestock, and wild animals (terrestrial mammals and birds)

Humans and our livestock now make up 97 percent of all animals on land.  Wild animals (mammals and birds) have been reduced to a mere remnant: just 3 percent.  This is based on mass.  Humans and our domesticated animals outweigh all terrestrial wild mammals and birds 32-to-1.

To clarify, if we add up the weights of all the people, cows, sheep, pigs, horses, dogs, chickens, turkeys, etc., that total is 32 times greater than the weight of all the wild terrestrial mammals and birds: all the elephants, mice, kangaroos, lions, raccoons, bats, bears, deer, wolves, moose, chickadees, herons, eagles, etc.  A specific example is illuminating: the biomass of chickens is more than double the total mass of all other birds combined.

Before the advent of agriculture and human civilizations, however, the opposite was the case: wild animals and birds dominated, and their numbers and mass were several times greater than their numbers and mass today. Before the advent of agriculture, about 11,000 years ago, humans made up just a tiny fraction of animal biomass, and domesticated livestock did not exist.  The current situation—the domination of the Earth by humans and our food animals—is a relatively recent development.

The preceding observations are based on a May 2018 report by Yinon Bar-On, Rob Phillips, and Ron Milo published in the academic journal Proceedings of the National Academy of Sciences.  Bar-On and his coauthors use a variety of sources to construct a “census of the biomass of Earth”; they estimate the mass of all the plants, animals, insects, bacteria, and other living things on our planet.

The graph above is based on data from that report (supplemented with estimates based on work by Vaclav Smil).  The graph shows the mass of humans, our domesticated livestock, and “wild animals”: terrestrial mammals and birds.  The units are millions of tonnes of carbon.*  Three time periods are listed.  The first, 50,000 years ago, is the time before the Quaternary Megafauna Extinction.  The Megafauna Extinction was a period when Homo sapiens radiated outward into Eurasia, Australia, and the Americas and contributed to the extinction of about half the planet’s large animal species (>44 kgs).  (Climate change also played a role in that extinction.)  In the middle of the graph we see the period around 11,000 years ago—before humans began practicing agriculture.  At the right-hand side we see the situation today.  Note how the first two periods are dominated by wild animals.  The mass of humans in those periods is so small that the blue bar representing human biomass is not even visible in the graph.**

This graph highlights three points:
1. wild animal numbers and biomass have been catastrophically reduced, especially over the past 11,000 years;
2. human numbers and livestock numbers have skyrocketed, to unnatural, abnormal levels; and
3. The downward trendline for wild animals visible in this graph is gravely concerning; this graph suggests accelerating extinctions.

Indeed, we are today well into the fastest extinction event in the past 65 million years.  According to the 2005 Millennium Ecosystem Assessment “the rate of known extinctions of species in the past century is roughly 50–500 times greater than the extinction rate calculated from the fossil record….”

The extinction rate that humans are now causing has not been seen since the Cretaceous–Paleogene extinction event 65 million years ago—the asteroid-impact-triggered extinction that wiped out the dinosaurs.  Unless we reduce the scale and impacts of human societies and economies, and unless we more equitably share the Earth with wild species, we will enter fully a major global extinction event—only the sixth in 500 million years.  To the other species of the Earth, and to the fossil record, human impacts increasingly resemble an asteroid impact.

In addition to the rapid decline in the mass and number of wild animals it is also worth contemplating the converse: the huge increase in human and livestock biomass.  Above, I called this increase “unnatural,” and I did so advisedly.  The mass of humans and our food animals is now 7 times larger than the mass of animals on Earth 11,000 or 50,000 years ago—7 times larger than what is normal or natural.  For millions of years the Earth sustained a certain range of animal biomass; in recent millennia humans have multiplied that mass roughly sevenfold.

How?  Fossil fuels.  Via fertilizers, petro-chemical pesticides, and other inputs we are pushing hundreds of millions of tonnes of fossil fuels into our food system, and thereby pushing out billions of tonnes of additional food and livestock feed.  We are turning fossil fuel Calories from the ground into food Calories on our plates and in livestock feed-troughs.   For example, huge amounts of fossil-fuel energy go into growing the corn and soybeans that are the feedstocks for the tens-of-billions of livestock animals that populate the planet.

Dr. Anthony Barnosky has studied human-induced extinctions and the growing dominance of humans and their livestock.  In a 2008 journal article he writes that “as soon as we began to augment the global energy budget, megafauna biomass skyrocketed, such that we are orders of magnitude above the normal baseline today.”  According to Barnosky “the normal biomass baseline was exceeded only after the Industrial Revolution” and this indicates that “the current abnormally high level of megafauna biomass is sustained solely by fossil fuels.”

Only a limited number of animals can be fed from leaves and grass energized by current sunshine.  But by tapping a vast reservoir of fossil sunshine we’ve multiplied the number of animals that can be fed.  We and our livestock are petroleum products.

There is no simple list of solutions to mega-problems like accelerating extinctions, fossil-fuel over-dependence, and human and livestock overpopulation.  But certain common sense solutions seem to present themselves.  I’ll suggest just one: we need to eat less meat and fewer dairy products and we need to reduce the mass and number of livestock on Earth.  Who can look at the graph above and come to any other conclusion?  We need not eliminate meat or dairy products (grazing animals are integral parts of many ecosystems) but we certainly need to cut the number of livestock animals by half or more.  Most importantly, we must not try to proliferate the Big Mac model of meat consumption to 8 or 9 or 10 billion people.  The graph above suggests a stark choice: cut the number of livestock animals, or preside over the demise of most of the Earth’s wild species.


* Using carbon content allows us to compare the mass of plants, animals, bacteria, viruses, etc.  Very roughly, humans and other animals are about half to two-thirds water.  The remaining “dry mass” is about 50 percent carbon.  Thus, to convert from tonnes of carbon to dry mass, a good approximation is to multiply by 2.

** There is significant uncertainty regarding animal biomass in the present, and much more so in the past.  Thus, the biomass values for wild animals in the graph must be considered as representing a range of possible values.  That said, the overall picture revealed in the graph is not subject to any uncertainty.  The overall conclusions are robust: the mass of humans and our livestock today is several times larger than wild animal biomass today or in the past; and wild animal biomass today is a fraction of its pre-agricultural value.

Graph sources:
– Yinon M. Bar-On, Rob Phillips, and Ron Milo, “The Biomass Distribution on Earth,” Proceedings of the National Academy of Sciences, May 17, 2018.
– Anthony Barnosky, “Megafauna Biomass Tradeoff as a Driver of Quaternary and Future Extinctions,” Proceedings of the National Academy of Sciences 105 (August 2008).
– Vaclav Smil, Harvesting the Biosphere: What We Have Taken from Nature (Cambridge, MA: MIT Press, 2013).

There are just two sources of energy

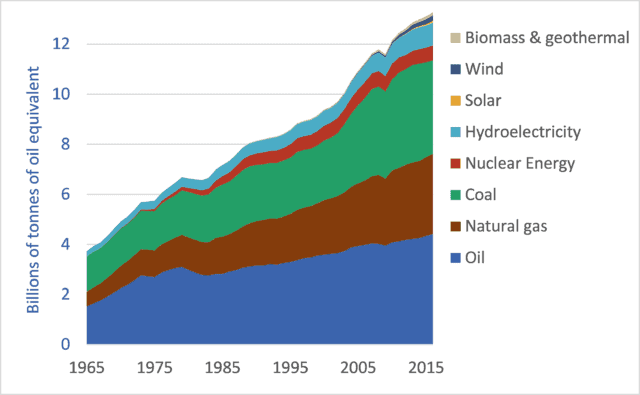
Graph of global primary energy supply by fuel or energy source, 1965-2016
Global primary energy consumption by fuel or energy source, 1965-2016

Our petro-industrial civilization produces and consumes a seemingly diverse suite of energies: oil, coal, ethanol, hydroelectricity, gasoline, geothermal heat, hydrogen, solar power, propane, uranium, wind, wood, dung.  At the most foundational level, however, there are just two sources of energy.  Two sources provide more than 99 percent of the power for our civilization: solar and nuclear.  Every other significant energy source is a form of one of these two.  Most are forms of solar.

When we burn wood we release previously captured solar energy.  The firelight we see and the heat we feel are energies from sunlight that arrived decades ago.  That sunlight was transformed into chemical energy in the leaves of trees and used to form wood.  And when we burn that wood, we turn that chemical-bond energy back into light and heat.  Energy from wood is a form of contemporary solar energy because it embodies solar energy mostly captured years or decades ago, as distinct from fossil energy sources such as coal and oil that embody solar energy captured many millions of years ago.

Straw and other biomass are a similar story: contemporary solar energy stored as chemical-bond energy then released through oxidation in fire.  Ethanol, biodiesel, and other biofuels are also forms of contemporary solar energy (though subsidized by the fossil fuels used to create fertilizers, fuels, etc.).

Coal, natural gas, and oil products such as gasoline and diesel fuel are also, fundamentally, forms of solar energy, but not contemporary solar energy: fossil.  The energy in fossil fuels is the sun’s energy that fell on leaves and algae in ancient forests and seas.  When we burn gasoline in our cars, we are propelled to the corner store by ancient sunlight.

Wind power is solar energy.  Heat from the sun creates air-temperature differences that drive air movements that can be turned into electrical energy by wind turbines, mechanical work by windmills, or geographic motion by sailing ships.

Hydroelectric power is solar energy.  The sun evaporates and lifts water from oceans, lakes, and other water bodies, and that water falls on mountains and highlands where it is aggregated by terrain and gravity to form the rivers that humans dam to create hydro-power.

Of course, solar energy (both photovoltaic electricity and solar-thermal heat) is solar energy.

Approximately 86 percent of our non-food energy comes from fossil-solar sources such as oil, natural gas, and coal.  Another 9 percent comes from contemporary solar sources, mostly hydro-electric, with a small but rapidly growing contribution from wind turbines and solar photovoltaic panels.  In total, then, 95 percent of the energy we use comes from solar sources—contemporary or fossil.  As is obvious upon reflection, the Sun powers the Earth.

The only major energy source that is not solar-based is nuclear power: energy from the atomic decay of unstable, heavy elements buried in the ground billions of years ago when our planet was formed.  We utilize nuclear energy directly, in reactors, and also indirectly, when we tap geothermal energies (atomic decay provides 60-80 percent of the heat from within the Earth).  Uranium and other radioactive elements were forged in the cores of stars that exploded before our Earth and Sun were created billions of years ago.  The source for nuclear energy is therefore not solar, but nonetheless stellar; energized not by our sun, but by another.  Our universe is energized by its stars.

There are two minor exceptions to the rule that our energy comes from nuclear and solar sources: Tidal power results from the interaction of the moon’s gravitational field and the initial rotational motion imparted to the Earth; and geothermal energy is, in its minor fraction, a product of residual heat within the Earth, and of gravity.  Tidal and geothermal sources provide just a small fraction of one percent of our energy supply.

Some oft-touted energy sources are not mentioned above.  Because some are not energy sources at all.  Rather, they are energy-storage media.  Hydrogen is one example.  We can create purified hydrogen by, for instance, using electricity to split water into its oxygen and hydrogen atoms.  But this requires energy inputs, and the energy we get out when we burn hydrogen or react it in a fuel cell is less than the energy we put in to purify it.  Hydrogen, therefore, functions like a gaseous battery: energy carrier, not energy source.

Understanding that virtually all energy sources are solar or nuclear in origin reduces the intellectual clutter and clarifies our options.  We are left with three energy supply categories when making choices about our future:
– Fossil solar: oil, natural gas, and coal;
– Contemporary solar: hydroelectricity, wood, biomass, wind, photovoltaic electricity, ethanol and biodiesel (again, often energy-subsidized from fossil-solar sources); and
– Nuclear.

Knowing that virtually all energy flows have their origins in our sun or other stars helps us critically evaluate oft-heard ideas that there may exist undiscovered energy sources.  To the contrary, it is extremely unlikely that there are energy sources we’ve overlooked.  The solution to energy supply constraints and climate change is not likely to be “innovation” or “technology.” Though some people hold out hope for nuclear fusion (creating a small sun on Earth rather than utilizing the conveniently-placed large sun in the sky) it is unlikely that fusion will be developed and deployed this century.  Thus, the suite of energy sources we now employ is probably the suite that will power our civilization for generations to come.  And since fossil solar sources are both limited and climate-disrupting, an easy prediction is that contemporary solar sources such as wind turbines and solar photovoltaic panels will play a dominant role in the future.


Graph sources: BP Statistical Review of World Energy 2017


A critically important solution to our climate crisis (and other crises)

Reconstructed wreckage of TWA Flight 800
US National Transportation Safety Board (NTSB) reconstruction of wreckage from TWA Flight 800

Ronald Wright’s A Short History of Progress is available as a book and as a five-part audio series—the 2004 CBC Massey Lectures.  (Listen here.)  In both its written and oral forms, A Short History of Progress is an accessible, eye-opening tour of humanity’s long historic journey—a look at the big picture and the long term.  It is aphoristic and packed with insights.  But one idea stands out.  Wright gets at this important idea by using the analogy of plane crashes.

Air travel today is very safe.  Mile for mile, your chances of being killed or injured while traveling on a commercial jetliner are about one one-hundredth your chances of suffering the same fate in your own car.  In 2016, zero people died in crashes of a US-based airlines operating anywhere in the world—the seventh year in a row that this was true (source here).

There’s a reason that airliners have become so safe: after every crash, well-resourced teams of highly-trained aviation experts are tasked with determining why a crash occurred, and once the cause is known the entire global aviation system implements changes to ensure that no plane in the future crashes for the same reasons.

Government agencies and airlines often expend enormous efforts to determine the cause of a crash.  The photograph above is of the reconstructed wreckage of TWA Flight 800, a Boeing 747 that crashed in 1996 after its fuel tank exploded, splitting the plane apart just ahead of the wings.  The plane crashed into the ocean off the coast of New York.  All 230 people aboard died.

The debris field covered several square miles.  In a massive effort, approximately 95 percent of the plane’s wreckage was salvaged from the sea.  The plane was painstakingly reconstructed.  And using the reconstructed plane as well as the flight data and cockpit voice recorders, the cause of the failure was traced back to a short circuit in wiring connected to the “fuel quantity indication system” in the centre fuel tank.  As a result of this investigation, changes were made to planes around the world to ensure that no similar crashes would occur.  As a result of crash investigations around the world, airlines and aircraft makers have made thousands of changes to airplane construction, crew training, air traffic control, airport security, airline maintenance, and operating procedures.  The results, as noted above, have been so successful that some years now pass without, for instance, a single fatality on a US airline.

Ronald Wright argues that the ruins and records of fallen civilizations can be investigated like airplane crash sites, and we can use the lessons we learn to make changes that can safeguard our current global civilization against similar crashes.  He writes that these ruined cities and civilizations are like “fallen airliners whose black boxes can tell us what went wrong” so that we can “avoid repeating past mistakes of flight plan, crew selection, and design.”  When Wright talks metaphorically about “flight plan,” consider our own plan to increase the size of the global economy tenfold, or more, this century.  And when he talks about crew selection, think about who’s in the cockpit in the United States.

Wright continues: “While the facts of each case [of civilizational collapse] differ, the patterns are alarmingly … similar.  We should be alarmed by the predictability of our mistakes but encouraged that this very fact makes them useful for understanding what we face today.”

Wright urges us to deploy our archaeologists, historians, anthropologists, ecologists, and other experts as crash-scene investigators—to read “the flight recorders in the wreckage of crashed civilizations,” and to take what we learn there and make changes to our own.  It is good advice.  It is, perhaps, the best advice our global mega-civilization will ever receive. 

While the crash of a jetliner may kill hundreds, the crash of our mega-civilization could kill billions.  And as more passengers pile in, as our global craft accelerates, and as the reading on the fuel-gauge drops and our temperature gauge rises, we should become more and more concerned about how we will keep our civilizational jetliner aloft through the storms to come.

Photo source: Newsday 

Everything must double: Economic growth to mid-century

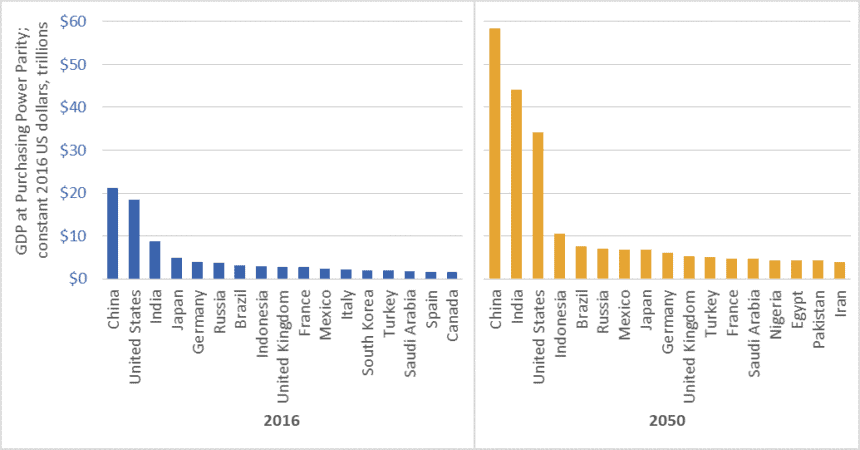
Graph of GDP of the world's largest economies, 2016 vs 2050
Size of the world’s 17 largest economies, 2016, and projections for 2050

In February 2017, global accounting firm PricewaterhouseCoopers (PwC) released a report on economic growth entitled The Long View: How will the Global Economic Order Change by 2050?  The graph above is based on data from that report.  (link here)  It shows the gross domestic product (GDP) of the largest economies in the world in 2016, and projections for 2050.  The values in the graph are stated in constant (i.e., inflation adjusted) 2016 dollars.

PwC projects that China’s economy in 2050 will be larger than the combined size of the five largest economies today—a list that includes China itself, but also the US, India, Japan, and Germany.

Moreover, the expanded 2050 economies of China and India together ($102.5 trillion in GDP) will be almost as large as today’s global economy ($107 trillion).

We must not, however, simply focus on economic growth “over there.”  The US economy will nearly double in size by 2050, and Americans will continue to enjoy per-capita GDP and consumption levels that are among the highest in the world.  The size of the Canadian economy is similarly projected to nearly double.   The same is true for several EU countries, Australia, and many other “rich” nations.

Everything must double

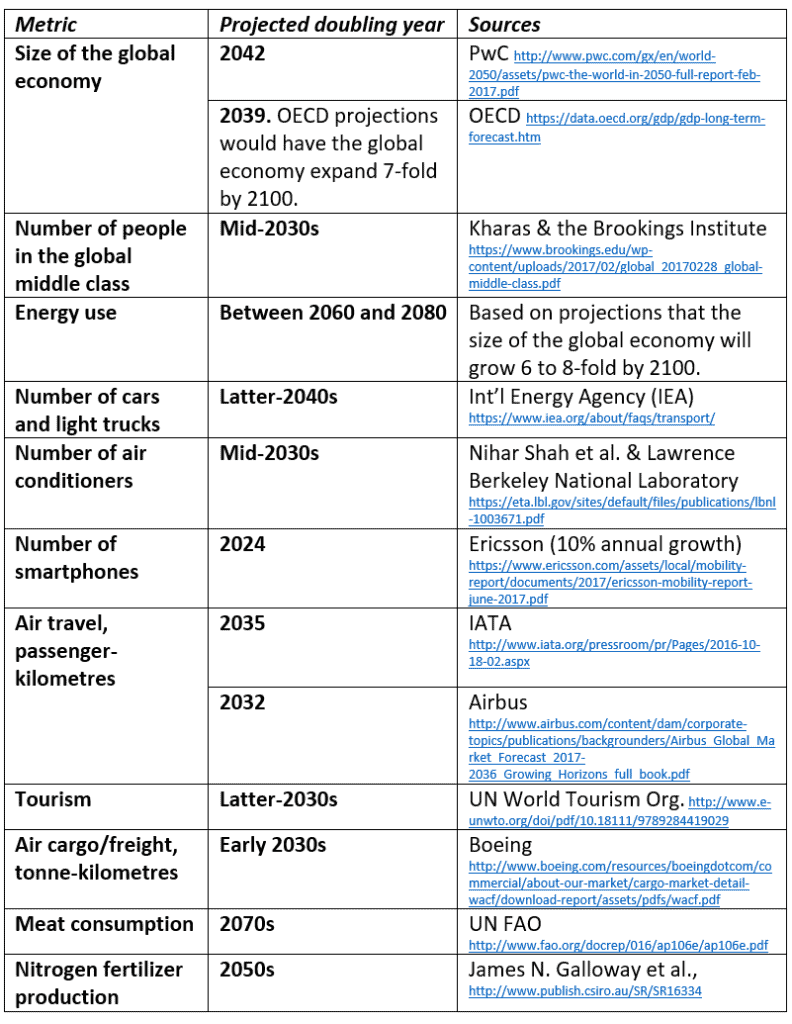
PwC’s report tells us that between now and 2050, the size of the global economy will more than double.  Other reports concur (See the OECD data here).  And this doubling of the size of the global economy is just one metric—just one aspect of the exponential growth around us.  Indeed, between now and the middle decades of this century, nearly everything is projected to double.  This table lists just a few examples.

Table of projected year of doubling for various energy, consumption, transport, and other metrics
Projected year of doubling for selected energy, consumption, and transport metrics

At least one thing, however, is supposed to fall to half

While we seem committed to doubling everything, the nations of the world have also made a commitment to cut greenhouse gas (GHG) emissions by half by the middle decades of this century.  In the lead-up to the 2015 Paris climate talks, Canada, the US, and many other nations committed to cut GHG emissions by 30 percent by 2030.  Nearly every climate scientist who has looked at carbon budgets agrees that we must cut emissions even faster.  To hold temperature increases below 2 degrees Celsius relative to pre-industrial levels, emissions must fall by half by about the 2040s, and to near-zero shortly after.

Is it rational to believe that we can double the number of cars, airline flights, air conditioners, and steak dinners and cut global GHG emissions by half?

To save the planet from climate chaos and to spare our civilization from ruin, we must—at least in the already-rich neighborhoods—end the doubling and redoubling of economic activity and consumption.  Economic growth of the magnitude projected by PwC, the OECD, and nearly every national government will make it impossible to cut emissions, curb temperature increases, and preserve advanced economies and stable societies.  As citizens of democracies, it is our responsibility to make informed, responsible choices.  We must choose policies that curb growth.

Graph source: PriceWaterhouseCoopers

$20 TRILLION: US national debt, and stealing from the future

Debt clock showing that the US national debt has topped $20 trillion

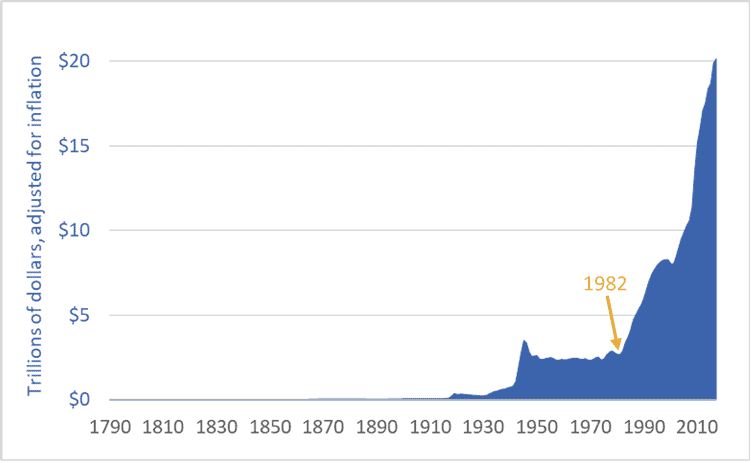
Bang!  Last week, US national debt broke through the $20 trillion mark.  As I noted in a previous post (link here), debt of this magnitude works out to about $250,000 per hypothetical family of four.

Moreover, US national debt is rising faster than at any time in history.  Adjusted for inflation, the debt is seven times higher than in 1982 ($20 trillion vs. $2.9 trillion).  Indeed, it was in 1982—not 2001 or 2008—that US government debt began its unprecedented (and probably disastrous) rise.

The graph below shows US debt over the past 227 years.  The figures are adjusted for inflation (i.e., they are stated in 2017 US dollars).

Graph of US national debt, historic, 1790 to 2017
United States national debt, adjusted for inflation, 1790-2017

It’s important to understand what is happening here: the US is transferring wealth from the future into the present.  The United States government is not merely engaging in some Keynesian fiscal stimulus, it is not simply borrowing for a rainy day (or 35 years of rainy days), it is not just taking advantage of low interest rates to do a bit of infrastructural fix-up or job creation, and it is not just responding to the financial crisis of 2008.  No.  The US government, the nation’s elites, its corporations, and its citizens are engaging in a form of temporal imperialism—colonizing the future and plundering its wealth.  They are today spending wealth that, if this debt is ever to be repaid, will have to be created by workers toiling in decades to come.

You cannot understand our modern world unless you understand this: Fossil-fueled consumer-industrial economies such as those in the US, Canada, and the EU draw heavily from the future and the past.

We reach back in time hundreds-of-millions of years to source the fossil fuels to power our cars and cities.  We are increasingly reliant on hundred-million-year-old sunlight to feed ourselves—accessing that ancient sunshine in the form of natural gas we turn into nitrogen fertilizer and enlarged harvests.  At the same time, we irrigate many fields from fossil aquifers, created at the end of the last ice age and now pumped hundreds of times faster than they refill.  We extract metal ores concentrated in the distant past.  And the cement in the concrete that forms our cities is the calcium-rich remnants of tiny sea creatures that lived millions of years ago.  We have thrust the resource-intake pipes for our food, industrial, and transport systems hundreds-of-millions of years into the past.

We also reach forward in time, consuming the wealth of future generations as we borrow and spend trillions of dollars they must repay; live well in the present at the expense of their future climate stability; deplete resources, clear-cut ecosystems, extinguish species, and degrade soils and water supplies.  We consume today and push the bills into the future.  This is the real meaning of the news that US national debt has now topped $20 trillion.

Graph sources: U.S. Department of the Treasury, “TreasuryDirect: Historical Debt Outstanding–Annual”  (link here

Falling per-capita farmland raises critical questions

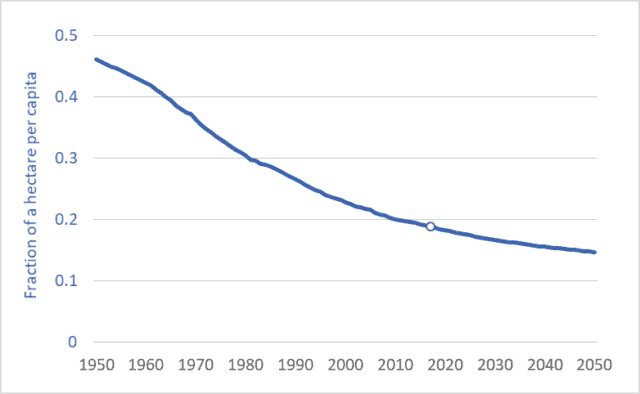
Graph of per capita farmland arable land, global, 1950 to 2050
Per-capita arable land (cropland), world average, 1950 to 2050.

As populations continue rising, per-capita farmland area is falling.  In 1950, for each person in the world (about 2.5 billion back then) there was, on average, 0.46 hectares of cropland (“arable” land).  That is an area roughly equal to the in-bounds playing area of a US football field.  Today, per-capita cropland area is just 0.19 hectares.  By 2050, it will be lower still: 0.15 hectares—one-third the area in 1950.  We’ll soon be down to just a third of a football field each.

The graph above shows the average per-capita cropland area from 1950 to 2050.  The units are fractions of a hectare.

Humanity’s in a bind.  We’re becoming more numerous.  The UN predicts a global population of 9.8 billion by mid-century.  Moreover, we’re becoming richer.  Projected rates of economic growth—3 percent compounded annually, according to the World Bank—will cause the size of the global economy to nearly triple by 2050.  That enlarged, enriched population will want to consume more food.  It will want to consume more of its food in the form of meat rather than vegetables or grains.  It will be more prone to overeating and more demanding of processed foods and junk food.  And it will waste more of its food, because comfortable, well-fed people do that.  In addition, more food will be diverted to energy and fuel uses, including biofuels for air travel and ocean shipping.  Based on these factors, the UN projects that food production in 2050 will have to be 70 percent higher than in 2005 (see here or here).

Here’s the bind.  In order to deal with climate change, the world’s governments have committed to reducing GHG emissions by 30 percent by 2030—just over 12 years from now.  And reductions of 50 to 80 percent are needed by 2050.  How do we expand food supplies and reduce emissions?  Bringing new land into production (Amazon rainforest, for example) emits huge plumes of GHGs as soil carbon is released by tillage.  If we want to reduce emissions we cannot afford to continue releasing carbon stored in forests or grasslands.  So the alternative is to intensify production—produce more on the land we already have.  This usually requires more fertilizer.  But the most used and most critical fertilizer, nitrogen, is made from natural gas and is a major source of GHG emissions.  Globally, nitrogen (N) fertilizer use has doubled since the 1970s (see blog post here); Canadian farmers have doubled their N use since the 1990s.  Our commitments to downward-trending GHG emissions is already in conflict with upward trending nitrogen fertilizer usage.

In the face of monumental problems such as these it is best to just spend some time mulling our predicament.  We must resist the “rush to solutions.”  For now, let’s just consider some questions:
– Can we continue to waste 20 to 40 percent of our food?
– Can we burn food in cars and airliners and cruise ships?
– Should we increase livestock production by two-thirds in the next three decades (as the UN predicts), knowing that many livestock production systems inefficiently turn 5 to 10 Calories worth of grain into one Calorie of meat?
– Should we continue to make bad food out of good—producing millions of tonnes of nutritionally disfigured foods such as soft drinks, cocoa puffs, and potato chips?  (One quarter of US Calories now come from junk food.  See here.)
– Should we continue to foster a food industry that promotes over-eating and resulting health problems?

As our per-capita land base contracts, and as our atmospheric emission-space fills, can we afford these extravagances?  …these follies?  An adequate response to these problem will require re-imagining and restructuring of our food system–fundamental changes to food production and consumption.

Graph sources: FAOSTAT and the UN Population Division 


Efficiency, the Jevons Paradox, and the limits to economic growth

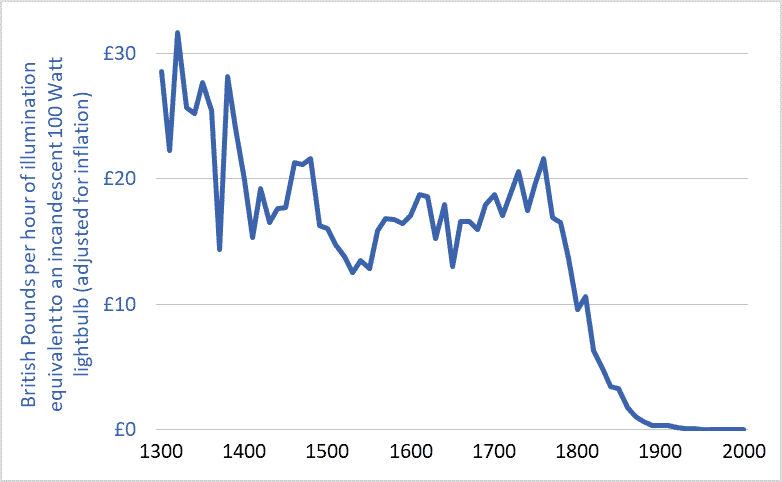
Graph of the cost of lighting in the UK, 1300-2000

I’ve been thinking about efficiency.  Efficiency talk is everywhere.  Car buyers can purchase ever more fuel-efficient cars.  LED lightbulbs achieve unprecedented efficiencies in turning electricity into visible light.  Solar panels are more efficient each year.  Farmers are urged toward fertilizer-use efficiency.  And our Energy Star appliances are the most efficient ever, as are the furnaces and air conditioners in many homes.

The implication of all this talk and technology is that efficiency can play a large role in solving our environmental problems.  Citizens are encouraged to adopt a positive, uncritical, and unsophisticated view of efficiency: we’ll just make things more efficient and that will enable us to reduce resource use, waste, and emissions, to solve our problems, and to pave the way for “green growth” and “sustainable development.”

But there’s something wrong with this efficiency solution: it’s not working.  The current environmental multi-crisis (depletion, extinction, climate destabilization, ocean acidification, plastics pollution, etc.) is not occurring as a result of some failure to achieve large efficiency gains.  The opposite.  It is occurring after a century of stupendous and transformative gains.  Indeed, the efficiencies of most civilizational processes (e.g., hydroelectric power generation, electrical heating and lighting, nitrogen fertilizer synthesis, etc.) have increased by so much that they are now nearing their absolute limits—their thermodynamic maxima.  For example, engineers have made the large electric motors that power factories and mines exquisitely efficient; those motors turn 90 to 97 percent of the energy in electricity into usable shaft power.  We have maximized efficiencies in many areas, and yet our environmental problems are also at a maximum.  What gives?

There are many reasons why efficiency is not delivering the benefits and solutions we’ve been led to expect.  One is the “Jevons Paradox.”  That Paradox predicts that, as the efficiencies of energy converters increase—as cars, planes, or lightbulbs become more efficient—the cost of using these vehicles, products, and technologies falls, and those falling costs spur increases in use that often overwhelm any resource-conservation gains we might reap from increasing efficiencies.  Jevons tells us that energy efficiency often leads to more energy use, not less.  If our cars are very fuel efficient and our operating costs therefore low, we may drive more, more people may drive, and our cities may sprawl outward so that we must drive further to work and shop.  We get more miles per gallon, or per dollar, so we drive more miles and use more gallons.  The Jevons Paradox is a very important concept to know if you’re trying to understand our world and analyze our situation.

The graph above helps illustrate the Jevons Paradox.  It shows the cost of a unit of artificial light (one hour of illumination equivalent to a modern 100 Watt incandescent lightbulb) in England over the past 700 years.  The currency units are British Pounds, adjusted for inflation.  The dramatic decline in costs reflects equally dramatic increases in efficiency.

Adjusted for inflation, lighting in the UK was more than 100 times more affordable in 2000 than in 1900 and 3,000 time more affordable than in 1800.  Stated another way, because electrical power plants have become more efficient (and thus electricity has become cheaper), and because new lighting technologies have become more efficient and produce more usable light per unit of energy, an hour’s pay for the average worker today buys about 100 times more artificial light than it did a century ago and 3,000 time more than two centuries ago.

But does all this efficiency mean that we’re using less energy for lighting?  No.  Falling costs have spurred huge increases in demand and use.  For example, the average UK resident in the year 2000 consumed 75 times more artificial light than did his or her ancestor in 1900 and more than 6,000 times more than in 1800 (Fouquet and Pearson).  Much of this increase was in the form of outdoor lighting of streets and buildings.  Jevons was right: large increases in efficiency have meant large decreases in costs and large increases in lighting demand and energy consumption.

Another example of the Jevons Paradox is provided by passenger planes.  Between 1960 and 2016, the per-seat fuel efficiency of jet airliners tripled or quadrupled (IPCC).  This, in turn, helped lower the cost of flying by more than 60%.  A combination of lower airfares, increasing incomes, and a growing population has driven a 50-fold increase in global annual air travel since 1960—from 0.14 trillion passenger-kilometres per year to nearly 7 trillion (see here for more on the exponential growth in air travel).  Airliners have become three or four times more fuel efficient, yet we’re now burning seventeen times more fuel.  William Stanley Jevons was right.

One final point about efficiency.  “Efficiency” talk serves an important role in our society and economy: it licenses growth.  The idea of efficiency allows most people to believe that we can double and quadruple the size of the global economy and still reduce energy use and waste production and resource depletion.  Efficiency is one of our civilization’s most important licensing myths.  The concept of efficiency-without-limit has been deployed to green-light the project of growth-without-end.

Graph sources: Roger Fouquet, Heat Power and Light: Revolutions in Energy Services

Full-world economics and the destructive power of capital: Codfish catch data 1850 to 2000

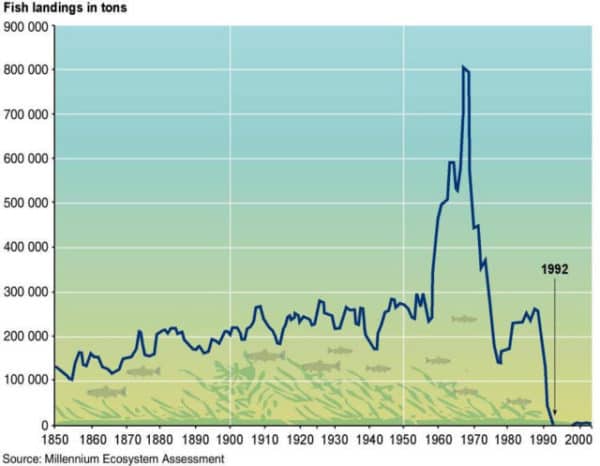
Graph of North Atlantic cod fishery, fish landing in tonnes, 1850 to 2000
Codfish catch, North Atlantic, tonnes per year

Increasingly, the ideas of economists guide the actions of our elected leaders and shape the societies and communities in which we live.  This means that incorrect or outdated economic theories can result in damaging policy errors.  So we should be concerned to learn that economics has failed to take into account a key transition: from a world relatively empty of humans and their capital equipment to one now relatively full.

A small minority of economists do understand that we have made an important shift.  In the 1990s, Herman Daly and others developed the idea that we have shifted to “full-world economies.”  (See pages 29-40 here.)  The North Atlantic cod fishery illustrates this transition.  This week’s graph shows tonnes of codfish landed per year, from 1850 to 2000.

Fifty years ago, when empty-world economics still held, the fishery was constrained by a lack of human capital: boats, motors, and nets.  At that time, adding more human capital could have caused the catch to increase.  Indeed, that is exactly what happened in the 1960s when new and bigger boats with advanced radar and sonar systems were deployed to the Grand Banks and elsewhere.  The catch tripled.  The spike in fish landings is clearly visible in the graph above.

But in the 1970s and ’80s, a shift occurred: human capital stocks—those fleets of powerful, sonar-equipped trawlers—expanded so much that the limiting factor became natural capital: the supply of fish.  The fishery began to collapse and no amount of added human capital could reverse the decline.  The system had transitioned from one constrained by human capital to one constrained by natural capital—from empty-world to full-world economics.  A similar transition is now evident almost everywhere.

An important change has occurred.  Unfortunately, economics has not internalized or adapted to this change.  Economists, governments, and business-people still act as if the shortage is in human-made capital.  Thus, we continue our drive to amass capital—we expand our factories, technologies, fuel flows, pools of finance capital, and the size of our corporations, in order to further expand the quantity and potency of human-made capital stocks.  Indeed, this is a defining feature of our economies: the endless drive to expand and accumulate supplies of capital.  That is why our system is called “capitalism.”  And a focus on human-made capital was rational when it was in short supply.  But now, in most parts of the world, human capital is too plentiful and powerful and and, thus, destructive.  It is nature and natural capital that is now scarce and limiting.  This requires an economic and civilizational shift: away from a focus on amassing human capital and toward a focus on protecting and maximizing natural capital: forests, soils, water, fish, biodiversity, wild animal populations, a stable climate, and intact ecosystems.  Failure to make that shift will push more and more of the systems upon which humans depend toward a collapse that mirrors that of the cod stock.

Graph source:  United Nations GRID-Arendal, “Collapse of Atlantic cod stocks off the East Coast of Newfoundland in 1992