New report on agriculture, GHG emissions, climate change, and the farm income crisis

Cover of Tackling the Farm Crisis and the Climate Crisis by Darrin Qualman

How can we reduce agricultural greenhouse gas (GHG) emissions by half by mid-century?  And how can steps to do so help strengthen and safeguard family farms?  These two questions are the focus of a new report written by Darrin Qualman in collaboration with the National Farmers Union (NFU).  The report is entitled Tackling the Farm Crisis and the Climate Crisis: A Transformative Strategy for Canadian Farms and Food Systems and it’s available from the NFU website.

The report looks at the climate crisis and the farm income crisis.  It concludes that our farms’ high emissions and low net incomes have the same cause: overdependence on purchased inputs: fertilizers, chemicals, fuels, etc.

The report shows clearly that the GHG emissions coming out of our farm and food systems are simply the downstream byproducts of the petro-industrial inputs we push in.  “Push in millions of gallons of fossil fuels and they will come out as millions of tonnes of carbon dioxide.  Push in megatonnes of fertilizers and they will come out as megatonnes of nitrous oxide.  As we have doubled and redoubled input use, we have doubled and redoubled the GHG emissions from agriculture,” states the report.  From this novel observation comes an inescapable conclusion: “Any low-emission food system will be a low-input food system.”

The report takes a long-term view and states that “10,000 years of human history makes one thing crystal clear: farming does not create GHG emissions; petro-industrial farm inputs create GHG emissions.”  It goes on to state that “Two things happen when farmers become overdependent on  purchased inputs: emissions go up, and net incomes go down.”

The report is optimistic, however, arguing that solutions to climate problems can also be solutions to farm income problems.  On average, farmers are now retaining just five cents out of every dollar they earn.  The other 95 cents go to pay for inputs—to pay fertilizer, chemical, seed, fuel, and machinery companies and other input and service providers.  But as input use is reduced as a way to reduce emissions, margins and net incomes can go up.  Steps to deal with the climate crisis can also be steps to solve the farm income crisis.

The report explores dozens of practical on-farm measures and government policies that can, taken together, reduce agricultural emissions by half by mid-century.  The report, however, does not underestimate the scale of the task ahead.  It acknowledges that “farmers, other citizens, all sectors, and all levels of government must mobilize, with near-wartime-levels of commitment and effectiveness, to slash emissions.  ”

The report is a hopeful blueprint for the transformation of our farms and food systems.  “We are looking at a future wherein agriculture must increasingly re-merge with nature and culture to create a much more integrated, life-sustaining, and community-sustaining agroecological model of human food provision, nutrition, and health.”

Darrin Qualman worked as Director of Research for the National Farmers Union from 1996 to 2010.  He is the author of the book, published in 2019, Civilization Critical: Energy, Food, Nature, and the Future.

Click HERE to read the report.

Through the mill: 150 years of wheat price data

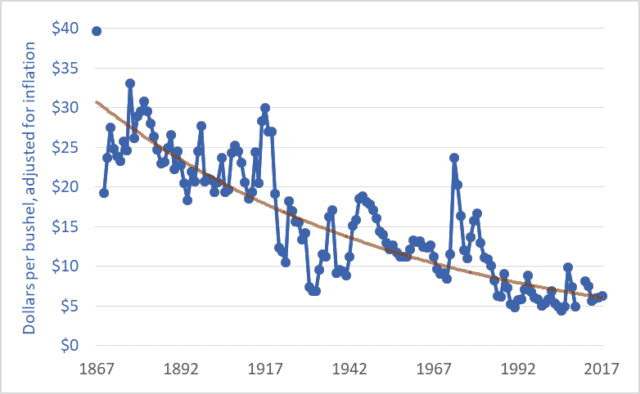
Graph of wheat price, western Canada (Sask. or Man.), farmgate, dollars per bushel, 1867–2017
Wheat price, western Canada (Sask. or Man.), farmgate, dollars per bushel, 1867–2017

The price of wheat is declining, and it has been for many years.  The same is true for the prices of other grains and oilseeds.  The graph above shows wheat prices in Canada since Confederation—over the past 150 years.  The units are dollars per bushel.  A bushel is 60 pounds (27 kilograms).  The brown line suggests a trendline.

These prices are adjusted for inflation.  The downward trend reflects the fact that wheat prices fell relative to prices for nearly all other goods and services; as time went on it took more and more bushels of wheat or other grains to buy a pair of shoes, lunch, or a movie ticket.  For example, my father bought a new, top-of-the-line pickup truck in 1976 for $6,000, equivalent to about 1,200 bushels of wheat at the time.  Today, a comparable pickup (base model) might cost the equivalent of about 4,000 bushels of wheat.  As a second example, a house in 1980 might have cost the equivalent of 20,000 bushels of wheat; today, that very same house would cost the equivalent of 60,000 bushels.

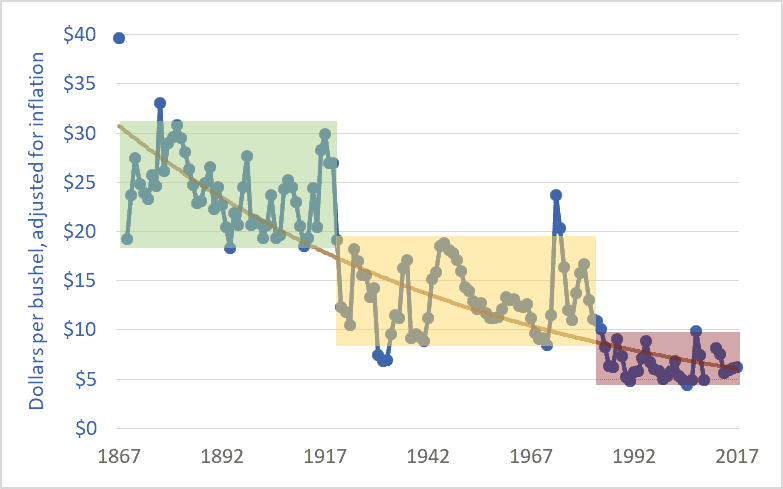
The graph below adds shaded boxes to highlight three distinct periods in Canadian wheat prices.  The period from Confederation to the end of the First World War saw prices roughly in the range of $20 to $30 per bushel (adjusted to today’s dollars).  From 1920 to the mid-’80s, prices entered a new phase, and oscillated between about $8 and $18 per bushel.  And in 1985, wheat prices entered a third phase, oscillating between $5 and $10 per bushel, more often closer to $5 than $10.  In each phase, the top of the range in a given period is roughly equal to the bottom of the range in the previous period.

Graph of wheat price, western Canada (Sask. or Man.), farmgate, dollars per bushel, 1867–2017
Wheat price, western Canada, farmgate, dollars per bushel

1985 is often cited as the beginning of the farm crisis period.  The graph above shows why the crisis began in that year.  Grain prices since the mid-’80s have been especially damaging to Canadian agriculture.  The post-1985 collapse in grain prices has had several effects:

– The expulsion of one-third of Canadian farm families in just one generation;
– The expulsion of two-thirds of young farmers (under 35 years of age) over the same period;
– A tripling of farm debt, to a record $102 billion;
– A chronic need to transfer taxpayer dollars to farmers through farm-support programs (with transfers totaling $110 billion since 1985); and
– A push toward farm giantism, with the majority of land in western Canada now operated by farms larger than 3,000 acres, and with many farms covering tens-of-thousands of acres.

As per-bushel and per-acre margins fall, the solution is to cover more acres.  The inescapable result is fewer farms and farmers.

It is impossible to delve into all the causes of the grain price decline in one blog post.  Briefly, farmers are getting less and less because others are taking more and more.  A previous blog post highlighted the widening gap between what Canadians pay for bread in the grocery store and what farmers receive for wheat at the elevator.  This widening gap is created because grain companies, railways, milling companies, other processors, and retailers are taking more and more, chocking off the flow of dollars to farmers.  This is manifest in declining prices.  Agribusiness giants are profiting by charging consumers more per loaf and paying farmers less per bushel.

Of course, grain prices are a function of domestic and international markets.  The current free trade and globalization era began in the mid-1980s.  (The Canada-US Free Trade Agreement was concluded in 1987, the North American Free Trade Agreement in 1994, and the World Trade Organization Agreement on Agriculture in 1995.)  The effect of free trade and globalization has been to plunge all the world’s farmers into a single, borderless, hyper-competitive market.  At the same time, agribusiness corporations entered a period of accelerating mergers in order to reduce the competition they faced.  As competition levels increase for farmers and decrease for agribusiness corporations it is easy to predict shifts in relative profitability.  Increased competition for farmers meant lower prices while decreased competition for agribusiness transnationals translated into higher prices and profits.

Graph sources:
– 1867–1974: Historical Statistics of Canada, eds. Leacy, Urquhart, and Buckley, 2nd ed. (Ottawa: Statistics Canada, 1983);
– 1890–1909: Wholesale Prices in Canada, 189O–19O9, ed. R. H. Coats (Ottawa: Government Printing Bureau, 1910);
– 1908–1984: Statistics Canada, Table: 32-10-0359-01 Estimated areas, yield, production, average farm price and total farm value of principal field crops (formerly CANSIM 001-0017);
– 1969–2009: Saskatchewan Agriculture and Food: Statfact, Canadian Wheat Board Final Price for Wheat, basis in store Saskatoon;
– 2012–2018: Statistics Canada, Table: 32-10-0077-01 Farm product prices, crops and livestock (formerly CANSIM 002-0043).

$100 billion and rising: Canadian farm debt

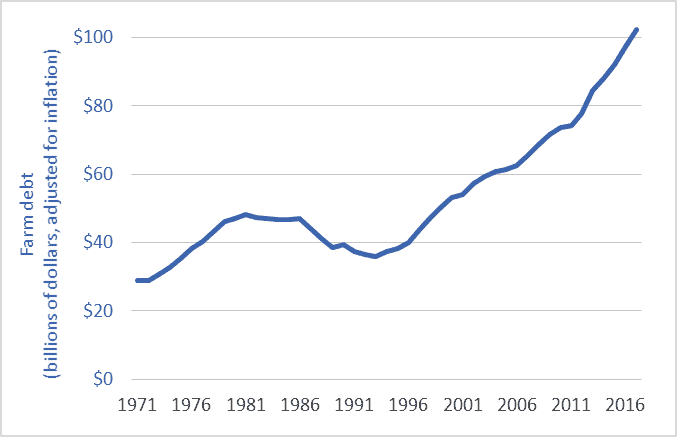
Graph of Canadian farm debt, 1971-2017
Canadian farm debt, 1971-2017

Canadian farm debt has risen past the $100 billion mark.  According to recently released Statistics Canada data, farm debt in 2017 was $102.3 billion—nearly double the level in 2000.  (All figures and comparisons adjusted for inflation.)

Some analysts and government officials characterize the period since 2007 as “better times” for farmers.  But during that period (2007-2017, inclusive) total farm debt increased by $37 billion—rising by more than $3 billion per year.

Here’s how Canadian agriculture has functioned during the first 18 years of the twenty-first century (2000 to 2017, inclusive):

1. Overall, farmers earned, on average, $47 billion per year in gross revenues from the markets (these are gross receipts from selling crops, livestock, vegetables, honey, maple syrup, and other products).

2. After paying expenses, on average, farmers were left with $1.6 billion per year in realized net farm income from the markets (excluding farm-support program payments).  If that amount was divided equally among Canada’s 193,492 farms, each would get about $8,300.

3. To help make ends meet, Canadian taxpayers transferred to farmers $3.1 billion per year via farm-support-program payments.

4. On top of this, farmers borrowed $2.7 billion per year in additional debt.

5. Farm family members worked at off-farm jobs to earn most of the household income needed to support their families (for data see here and here).

The numbers above give rise to several observations:

A. The amount of money that farmers pay each year in interest to banks and other lenders ($3 billion, on average) is approximately equal to the amount that Canadian citizens each year pay to farmers ($3.1 billion).  Thus, one could say that, in effect, taxpayers are paying farmers’ interest bills.  Governments are facilitating the transfer of tax dollars from Canadian families to farmers and on to banks and their shareholders.

B. Canadian farmers probably could not service their $100 billion dollar debt without government/taxpayer funding.

C. To take a different perspective: each year farmers take on additional debt ($2.7 billion, on average) approximately equal to the amount they are required to pay in interest to banks ($3 billion on average). One could say that for two decades banks have been loaning farmers the money needed to pay the interest on farmers’ tens-of-billions of dollars in farm debt.

Over and above the difficulty in paying the interest, is the difficulty in repaying the principle.  Farm debt now—$102 billion—is equal to approximately 64 years of farmers’ realized net farm income from the markets.  To repay the current debt, Canadian farm families would have to hand over to banks and other lenders every dime of net farm income from the markets from now until 2082.

The Canadian farm sector has many strengths.  By many measures, the sector is extremely successful and productive.  Over the past generation, farmers have managed to nearly double the value of their output and triple the value of agri-food exports.  Output per year, per farmer, and per acre are all up dramatically.  And Canadian farmers lead the world in adopting high-tech production systems.  The problem is not that our farms are backward, inefficient, or unproductive.  Rather, the problems detailed above are the result of voracious wealth extraction by the dominant agribusiness transnationals and banks. (To examine the extent of that wealth extraction, see my blog post here).

Although our farm sector has many strengths and is setting production records, the sector remains in a crisis that began in the mid-1980s.  And what began as a farm income crisis has metastasized into a farm debt crisis.  Further, the sector also faces a generational crisis (the number of farmers under the age of 35 has been cut by half since 2001) and a looming climate crisis.  Policy makers must work with farmers to rapidly restructure and transform Canadian agriculture.  A failure to do so will mean further costs to taxpayers, the destruction of the family farm, and irreparable damage to Canada’s food-production system.

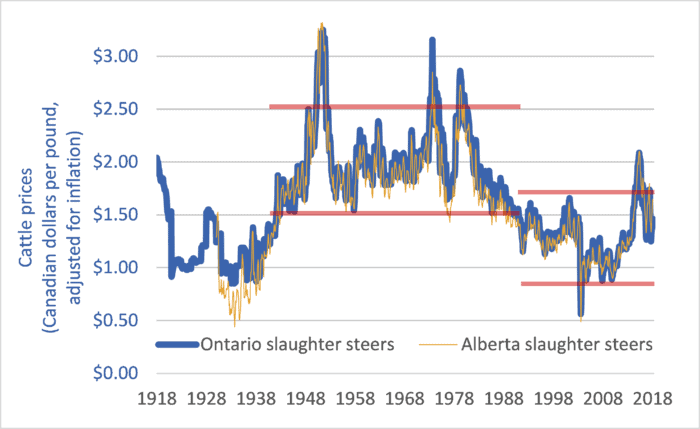
The cattle crisis: 100 years of Canadian cattle prices

Graph of Canadian cattle prices, historic, 1918-2018
Canadian cattle prices at slaughter, Alberta and Ontario, 1918-2018

Earlier this month, Brazilian beef packer Marfrig Global Foods announced it is acquiring 51 percent ownership of US-based National Beef Packing for just under $1 billion (USD).  The merged entity will slaughter about 5.5 million cattle per year, making Marfrig/National the world’s fourth-largest beef packer.  (The top-three are JBS, 17.4 million per year; Tyson, 7.7 million; and Cargill, 7.6.)  To put these numbers into perspective, with the Marfrig/National merger, the largest four packing companies will together slaughter about 15 times more cattle worldwide than Canada produces in a given year.  In light of continuing consolidation in the beef sector it is worth taking a look at how cattle farmers and ranchers are fairing.

This week’s graph shows Canadian cattle prices from 1918 to 2018.  The heavy blue line shows Ontario slaughter steer prices, and is representative of Eastern Canadian cattle prices.  The narrower tan-coloured line shows Alberta slaughter steer prices, and is representative for Western Canada.  The prices are in dollars per pound and they are adjusted for inflation.

The two red lines at the centre of the graph delineate the price range from 1942 to 1989.  The red lines on the right-hand side of the graph delineate prices since 1989.  The difference between the two periods is stark.  In the 47 years before 1989, Canadian slaughter steer prices never fell below $1.50 per pound (adjusted for inflation).  In the 28 years since 1989, prices have rarely risen that high.  Price levels that used to mark the bottom of the market now mark the top.

What changed in 1989?  Several things:

1.       The arrival of US-based Cargill in Canada in that year marked the beginning of integration and consolidation of the North American continental market.  This was later followed by global integration as packers such as Brazil-based JBS set up plants in Canada and elsewhere.

2.       Packing companies became much larger but packing plants became much less numerous.  Gone were the days when two or three packing plants in a given city would compete to purchase cattle.

3.       Packer consolidation and giantism was faciliated by trade agreements and global economic integration.  It was in 1989 that Canada signed the Canada-US Free Trade Agreement (CUSTA).  A few years later Canada would sign the NAFTA, the World Trade Organization (WTO) Agreement on Agriculture, and other bilateral and multilateral “free trade” deals.

4.       Packing companies created captive supplies—feedlots full of packer-owned cattle that the company could draw from if open-market prices rose, curtailing demand for farmers’ cattle and disciplining prices.

Prices and profits are only partly determined by supply and demand.  A larger factor is market power.  It is this power that determines the allocation of profits within a supply chain.  In the late ’80s and continuing today, the power balance between packers and farmers shifted as packers merged to become giant, global corporations.  The balance shifted as packing plants became less numerous, reducing competition for farmers’ cattle.  The balance shifted still further as packers began to utilize captive supplies.  And it shifted further still as trade agreements thrust farmers in every nation into a single, hyper-competitive global market.  Because market power determines profit allocation, these shifts increased the profit share for packers and decreased the share for farmers.   The effects on cattle farmers have been devastating.  Since the latter-1980s, Canada has lost half of its cattle farmers and ranchers.

For more background and analysis, please see the 2008 report by the National Farmers Union: The Farm Crisis and the Cattle Sector: Toward a New Analysis and New Solutions.

Graph sources: numerous, including Statistics Canada CANSIM Tables 002-0043, 003-0068, 003-0084; and  Statistics Canada “Livestock and Animal Products”, Cat. No. 23-203


The 100th Anniversary of high-input agriculture

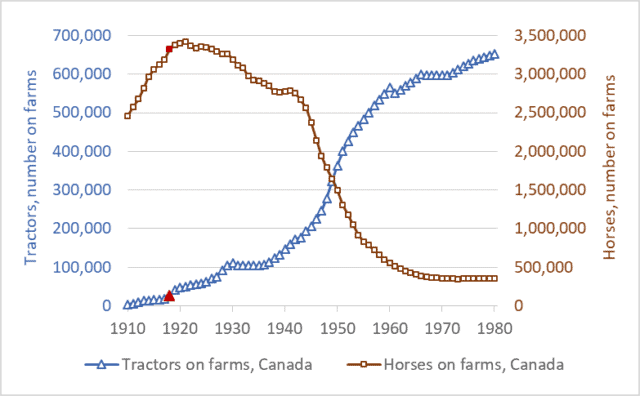
Graph of tractor and horse numbers, Canada, historic, 1910 to 1980
Tractors and horses on farms in Canada, 1910 to 1980

2018 marks the 100th anniversary of the beginning of input-dependent farming—the birth of what would become modern high-input agriculture.  It was in 1918 that farmers in Canada and the US began to purchase large numbers of farm tractors.  These tractors required petroleum fuels.  Those fuels became the first major farm inputs.  In the early decades of the 20th century, farmers became increasingly dependent on fossil fuels, in the middle decades most also became dependent on fertilizers, and in the latter decades they also became dependent on agricultural chemicals and high-tech, patented seeds.

This week’s graph shows tractor and horse numbers in Canada from 1910 to 1980.  On both lines, the year 1918 is highlighted in red.  Before 1918, there were few tractors in Canada.  The tractors that did exist—mostly large steam engines—were too big and expensive for most farms.  But in 1918 three developments spurred tractor proliferation: the introduction of smaller, gasoline-engine tractors (The Fordson, for example); a wartime farm-labour shortage; and a large increase in industrial production capacity.  In the final year of WWI and in the years after, tractor sales took off.  Shortly after, the number of horses on farms plateaued and began to fall.  Economists Olmstead and Rhode have produced a similar graph for the US.

It’s important to understand the long-term significance of what has unfolded since 1918.  Humans have practiced agriculture for about 10,000 years—about 100 centuries.  For 99 centuries, there were almost no farm inputs—no industrial products that farmers had to buy each spring in order to grow their crops.  Sure, before 1918, farmers bought farm implements—hoes, rakes, and sickles in the distant past, and plows and binders more recently.  And there were some fertilizer products available, such as those derived from seabird guano (manure) in the eighteenth and nineteenth centuries.  And farmers occasionally bought and sold seeds.  But for most farmers in most years before about 1918, the production of a crop did not require purchasing an array of farm inputs.  Farm chemicals did not exist, very little fertilizer was available anywhere in the world until after WWII, and farmers had little use for gasoline or diesel fuel.  Before 1918, farms were largely self-sufficient, deriving seeds from the previous years’ crop, fertility from manure and nitrogen-fixing crops, and pulling-power from horses energized by the hay and grain that grew on the farm itself.  For 99 of the 100 centuries that agriculture has existed, farms produced the animal- and crop-production inputs they needed.  Nearly everything that went into farming came out of farming.

For 99 percent of the time that agriculture has existed there were few farm inputs, no farm-input industries, and little talk of “high input costs.”  Agricultural production was low-input, low-cost, solar-powered, and low-emission.  In the most recent 100 years, however, we’ve created a new kind of agricultural system: one that is high-input, high-cost, fossil-fuelled, and high-emission.

Modern agriculture is also, admittedly, high-output.  But this last fact must be understood in context: the incredible food-output tonnage of modern agriculture is largely a reflection of the megatonnes of fertilizers, fuels, and chemicals we push into the system.  Nitrogen fertilizer illustrates this process.  To produce, transport, and apply one tonne of synthetic nitrogen fertilizer requires an amount of energy equal to almost two tonnes of gasoline.  Modern agriculture is increasingly a system for turning fossil fuel Calories into food Calories.  Food is increasingly a petroleum product.

The high-input era has not been kind to farmers.  Two-thirds of Canadian farmers have been ushered out of agriculture over the past two generations.  More troubling and more recent: the number of young farmers—those under 35—has been reduced by two-thirds since 1991.  Farm debt is at a record high: nearly $100 billion.  And about the same amount, $100 billion, has had to be transferred from taxpayers to farmers since the mid-1980s to keep the Canadian farm sector afloat.  Farmers are struggling with high costs and low margins.

This is not a simplistic indictment of “industrial agriculture.”  We’re not going back to horses.  But on the 100th anniversary of the creation of fossil-fuelled, high-input agriculture we need to think clearly and deeply about our food production future.  As our fossil-fuel supplies dwindle, as greenhouse gas levels rise, as we struggle to feed and employ billions more people, and as we struggle with many other environmental and economic problems, we will need to rethink and radically transform our food production systems.  Our current food system isn’t “normal”: it’s an anomaly—a break with the way that agriculture has operated for 99 percent of its history.  It’s time to ask hard questions and make big changes.  It’s time to question the input-maximizing production systems agribusiness corporations have created, and to explore new methods of low-input, low-energy-use, low-emission production.

Rather than maximizing input use, we need to maximize net farm incomes, maximize the number of farm families on the land, and maximize the resilience and sustainability of our food systems.

Cattle Rustling? The growing gap between cattle and beef prices

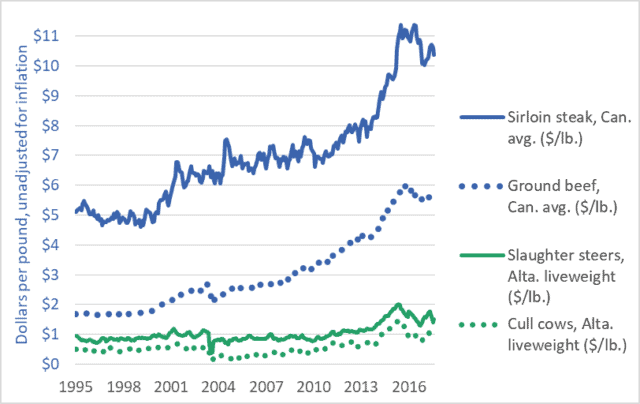
Graph of Canadian cattle prices and retail beef prices, 1995 to 2017
Retail prices of ground beef and steak compared to farmers’ prices for cattle, 1995–2017

This week’s graph highlights the growing gap between what Canadians pay for beef and what farmers receive for their cattle.  The rising blue lines show grocery-store prices for steak and ground beef.  The comparatively flat green lines represent the prices farmers and feedlot operators receive for the cattle they sell to beef packers.  Steers (castrated male cattle) are more likely to be the source of steaks, while cows are primarily turned into ground beef.

The blue lines show what consumers pay; the green lines show what farmers get.  The widening gap between the blue lines and the green lines reveals the amount that packers and retailers take for themselves.

Let’s look first at the dotted lines.  The green dotted line shows the per-pound price farmers in Alberta receive for their cows.  (prices across Canada are similar.)  In the decade-and-a-half before 2010, that price averaged about 50¢.  In recent years it has averaged about $1.00.  One could say that farmers are receiving an extra 50¢ per pound for their cows.  These figures do not take into account rising costs (they are not adjusted for inflation) but we’ll leave that issue aside for now.  Note what happens to the blue dotted line: the grocery-store price of ground beef.  It more than triples, from about $1.70 per pound to about $5.50.  Farmers’ prices increased by 100%, but packers and retailers increased their take by 320%.  Farmers’ prices increased by 50¢, but packers and retailers increased their prices by nearly $4.00.

The solid green line shows the price that farmers (or feedlot operators) receive for slaughter-ready steers.  The solid blue line is a representative price for grocery-store steaks.  If we compare recent years to those before 2013, we see that steer prices have risen by perhaps 50¢ or 60¢ per pound.  Over the same period, steak prices have risen by $5.00 or $6.00.

There is little discernible connection between the prices consumers pay and the prices farmers receive.  This is true of cattle and beef, but also true of nearly every other farm-retail product pair.  For a graph comparing the prices of wheat and bread, click here.  Similar “wedge” graphs can be created for corn and cornflakes, hogs and pork chops, and many other farm-retail product pairs.

Food processors, packers, and retailers are choking off the flow of dollars to Canadian farms, with devastating effects.  The number of Canadian farms raising cattle has been cut nearly in half in a generation—from 142,000 in 1995 to less than 75,000 today.  Moreover, many of these farms reporting cattle are dairy farms (which do sell cattle for slaughter, but support themselves primarily from milk sales).  The number of farms classified as “beef cattle ranching and farming, including feedlots” stood at just 36,000 in 2016.  Farm debt is a record $100 billion.  And the number of young farmers (<35 years of age) today is just one-third the number a generation ago.

Canadians are paying many times over.  We’re paying a high price at the store.  We’re paying again through our taxes to fund farm support programs—money paid to farmers to backfill for the dollars extracted by powerful transnational packers, processors, and retailers.  And we’re paying yet again as our rural economies are hollowed out, our communities decimated, our family farms destroyed, and our nation’s capacity to sustainably produce food is eroded.

Graph sources: Statistics Canada CANSIM Tables 326-0012 and 002-0043.  

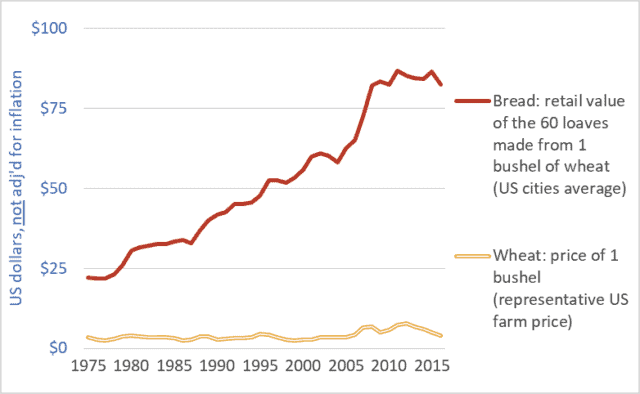
Taking nearly the whole loaf: US and Canadian wheat and bread prices, 1975 to present

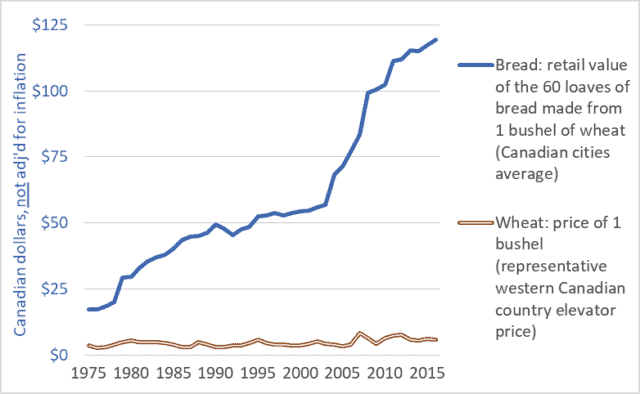
Graph of Canadian retail store bread price and country elevator wheat price, 1975-2016
Canadian retail store bread price and farm-gate wheat price, 1975-2016

Graph of United States retail store bread price and farm-gate wheat price, 1975-2016

United States retail store bread price and farm-gate wheat price, 1975-2016

It’s been said before but it bears repeating: farmers are making too little because others are taking too much.  For instance, food retailers, processors, grain companies, and railways are taking far too large a share of the retail price of bread.  And the share taken by these companies is increasing—choking off the flow of dollars to our family farms.  At the same time, these same corporations are profiteering by driving up the prices of the staple foods we all need to feed ourselves and our families.

This week’s two graph show data for the US and Canada.  Both graphs show the price of a bushel of wheat (the relatively flat line across the bottom of each graph) and the retail value of the approximately 60 loaves of bread that can be produced from a bushel of wheat (the upward-trending line in each graph).  The wheat prices are farm-gate or country elevator values.  The units are Canadian or US dollars, as appropriate, not adjusted for inflation.

The units are not important, however.  What is important is the widening gap between what consumers pay for bread and the amount of money that makes it back to the farm.  This growing gap represents the ever-larger share taken by food retailers, flour millers and other processors, railways, and elevator companies and grain traders.

Very little of the money spent in grocery stores makes it back to American or Canadian farms.  Compounding this problem is the fact that most of the money that does make it back to these farms is quickly captured by powerful farm-input companies. (See details here.)  Corporations upstream and downstream from farmers use their market power to capture huge profits for themselves while reducing net farm income to zero in many years.  To keep farms solvent, governments and citizens must step in with taxpayer-funded farm support payments.  In Canada, these payments have totaled $100 billion dollars over the past three decades, and more than $400 billion in the US.  From some perspectives, the primary beneficiaries of these payments are the executives and shareholders of the dominant agribusiness/food corporations.

Finally, there is the issue of efficiency.  Farmers are relentlessly urged to become more efficient.  Indeed, they are forced to increase efficiency simply to remain solvent in the face of declining farm-gate prices and rising input costs.  Farmers are so efficient today that they can produce grains and other products for 1970s’ prices.  But what of efficiency elsewhere in the system?  What does it indicate about the efficiency of huge corporate flour millers and food retailers if they must constantly take more and more money for themselves?  Are they becoming less efficient as they get larger?  Or are they simply using their increasing size and power to capture more profit for themselves?  And if citizens are going to be made to pay more for food anyway, then why badger farmers to become ever more efficient?

Farmers are the primary victims of the abuses of power within the food system.  But everyone is hurt as we are made to pay increased taxes to fund farm-support programs and to pay increased retail prices to support the outsized profit needs of the dominant food-system transnationals and their shareholders.

Graph sources:
Canadian bread: Statistics Canada, Consumer Prices and Price Indexes (Catalog number 62-010); CANSIM Table 326-0012.
US bread: Bureau of Labour Statistics, “Bread prices 1980-2015“.
Canadian wheat: Government of Saskatchewan, Saskatchewan Agriculture and Agri-food, “StatFacts-Canadian Wheat Board Payments for No. 1 CWRS”; CANSIM Table  002-0043.
US Wheat: United States Department of Agriculture, “Wheat Yearbook”   

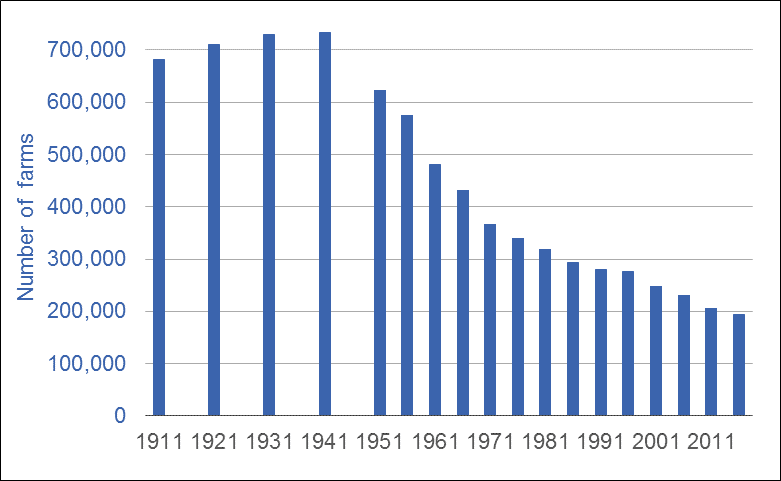
Losing the farm(s): Census data on the number of farms in Canada

Graph of the number of farms in Canada, Census years, 1911 to 2016
Number of farms in Canada, Census years, 1911 to 2016

Statistics Canada conducts its Census of Agriculture every five years.  Data from the 2016 Census was just released.  It shows that the number of farms in Canada continues to decline at an alarming rate.

The graph above shows the number of farms operating in Canada in each of the Census years from 1911 to 2016.  Over the past 30 years—1986 to 2016—Canada lost one-third of its farm families.  A generation ago there were just under 300,000 farms in Canada; today there are just under 200,000.

The continuing loss of farms and farmers damages Canadian food security and food sovereignty, our capacity to produce local food, our ability to adapt to climate change, and our prospects for building environmentally sustainable food systems.  It also has negative effect on employment and rural economic development.

But there is another consideration, one that should interest every Canadian: the number of farms in Canada was reduced by one-third during a thirty-year period when taxpayer-funded transfers to farmers, in the form of farm-support programs, totaled more than 100 billion dollars.  (All figures are adjusted for inflation.)  The public policies and taxpayer dollars that Canadians understand as helping “save the family farm” are having no such effect.

This failure of farm-support programs to stabilize the number of farms can be traced to two factors.  First, such programs lack appropriate payment caps. Caps on total annual payments of $200,000 to $300,000 per farm could slow farm-size expansion and the attendant loss of farms.  But payments under AgriStability—Canada’s primary income stabilization and support program—are capped at $3 million per farm per year.

Second, our agricultural policies do nothing to challenge the pathology underlying the farm income crisis: wealth extraction by agribusiness.  As noted in a previous blog, over the past 30 years agribusiness has made off with 98 percent of farmers’ revenues.  From some perspectives, farm-support programs can be seen as fulfilling an enabling role: keeping farm families solvent so that powerful corporations can bleed off wealth.

This is not an argument against farm support payments—vital crop insurance and income-stabilization programs.  But it is a suggestion that farmers, citizens, and governments should all look critically at the real-world effects of these programs and the tens-of-billions of taxpayers’ dollars these programs consume.  All citizens have an interest in maximizing the number of farm families on the land.  By that measure, our agricultural policies and programs are failing miserably.  Canada’s family farms are disappearing.

Graph sources:  Statistics Canada, Census of Agriculture, various years; and F.H. Leacy, M.C. Urquhart, and K.A.H. Buckley, eds., Historical statistics of Canada (Ottawa: Statistics Canada and the Social Science Federation of Canada, 1983)

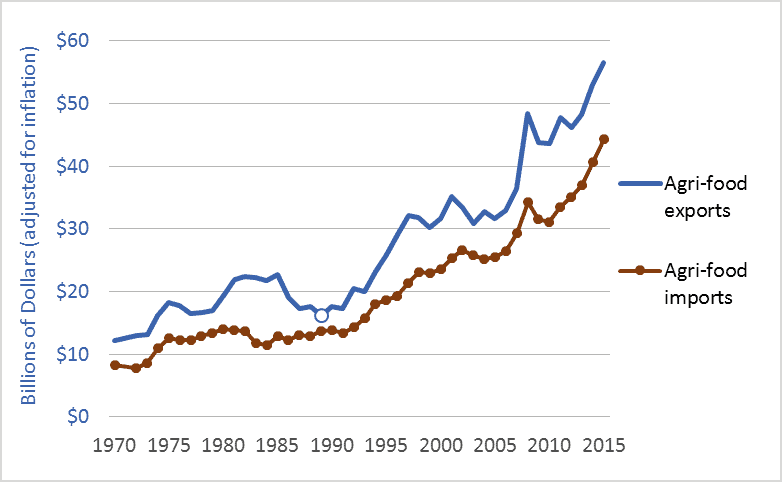
Far-flung food: local food falls victim to a fixation on food exports

A graph of Canadian agri-food exports and imports, 1970 to 2015
Canadian agri-food exports and imports, 1970 to 2015

The local food movement is important—a grassroots force for positive change.  People are increasingly aware of the benefits of eating local food and more are demanding it.  That said, it would be wrong to think that we are localizing our food system.  Just the opposite.  The most powerful players are putting their money and influence behind the project of globalizing and de-localizing our food supply.  Our food has never been less local.

In early-April, Canada’s federal government announced an ambitious new target for higher agri-food exports: $75 billion by 2025.  Unfortunately, as exports increase, so will imports.   We’re maximizing food miles.

The graph above shows Canadian agri-food exports and imports.  The units are billions of dollars, adjusted for inflation.  The graph covers 1970 to 2015.  A round circle highlights 1989, which marks the beginning of the modern “free trade” period.  In 1989, we implemented the historic Canada-US Free Trade Agreement (CUSTA).  Not long after, we implemented the North American Free Trade Agreement (NAFTA), and the World Trade Organization (WTO) Agreement on Agriculture.  Other agreements have followed.

Since ’89, Canada has been very successful in finding export markets for Canadian grains, meat, processed foods, and other agri-food products.  Exports have more than tripled.  This is no chance occurrence.  Governments and industry have worked together to drive up exports—repeatedly setting and meeting ever-higher targets.  In 1993, for example, federal and provincial governments pledged to double agri-food exports to $20 billion by 2000. Next, they pledged to double exports again: to $40 billion by 2005.  (This latter goal was actually suggested by the Canadian Agri-Food Marketing Council, an industry group that included representatives of Cargill, Maple Leaf, and McCains.)  Just last year, the Canadian Agri-Food Trade Alliance—whose members include some of the world’s largest agricultural traders and processors—voiced strong support for new trade agreements: the Comprehensive Economic and Trade Agreement (CETA) and the Trans-Pacific Partnership (TPP).  To support of this industry-led effort, the federal government has now pledged to help increase exports to $75 billion.  While many citizens want local food, governments and agribusiness appear to want the opposite.

The trade agreements that pave the way for Canadian exports do the same for imports.  Since 1989, Canadian food imports have more than tripled, to nearly $45 billion per year.  With each uptick in exports comes a comparable increase in imports.  If we reach our 2025 goal of $75 billion in exports, the trendlines in the graph above suggest that imports will rise to about $65 billion per year—on average, about $8,000 for a hypothetical family of four.  That’s a lot of imported food. Especially in a food-rich nation such as Canada.

The preceding is not an argument against exports and trade, or even against food imports.  But it is an argument against a simplistic fixation on exports.  While exports have doubled and redoubled, farmers’ net incomes have stagnated or fallen, the number of Canadian farms has been reduced by a third, farm debt has quadrupled, many Canadian processing companies have disappeared, and our agricultural and food systems have become increasingly controlled by foreign corporations.  Good agricultural policy must go far beyond a push to produce and export.  And a sound national food policy must go far, far beyond such simplistic schemes.

Graph sources: Agriculture and Agri-Food Canada (AAFC): “Agri-food Export Potential for the year 2000;” and data from AAFC by request.

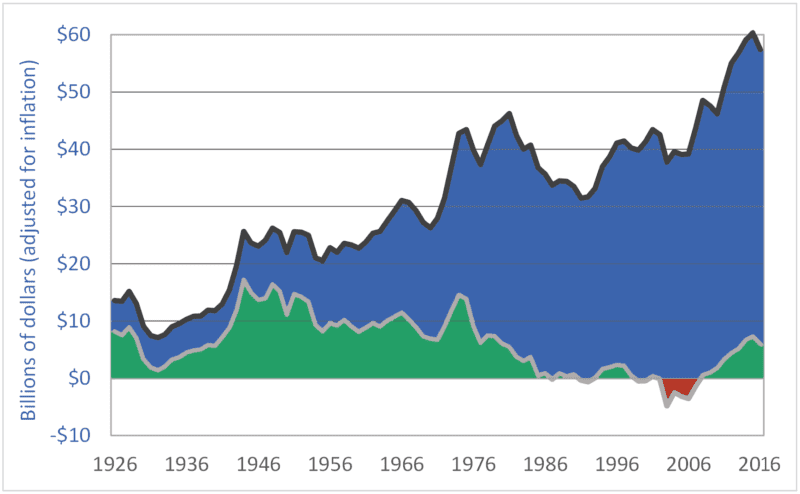
Agribusiness takes all: 90 years of Canadian net farm income

Graph of Canadian net farm income and gross revenues, 1926 to 2016
Canadian net farm income and gross revenue, inflation adjusted, net of government payments, 1926–2016.

Canadian net farm income remains low, despite a modest recovery during the past decade.  In the graph above, the black, upper line is gross farm revenue.  The lower, gray line is realized net farm income.  Both measures are adjusted for inflation.  And, in both cases, taxpayer-funded farm support payments are subtracted out, to remove the masking effects these payments can otherwise create.  The graph shows farmers’ revenues and net incomes from the markets.

The green-shaded area highlights periods of positive net farm income; the red-shaded area marks negative net income periods.  Most important, however, is the area shaded blue—the area between the gross revenue and net income lines.  That area represents farmers’ expenses: the amounts they pay to input manufacturers (Monsanto, Agrium, Deere, Shell, etc.) and service providers (banks, accountants, etc.).  Note how the blue area has expanded over time to consume almost all of farmers’ revenues, forcing Canadian net farm income lower and lower.

In the 23 years from 1985 to 2007, inclusive, the dominant agribusiness input suppliers and service providers captured 100 percent of Canadian farm revenues—100 percent!  During that period, all of farm families’ household incomes had to come from off-farm employment, taxpayer-funded farm-support programs, asset sales and depreciation, and borrowed money.  During that time, farmers produced and sold $870 billion worth of farm products, but expenses (i.e., amounts captured by input manufacturers and service providers) consumed the entire amount.

Bringing these calculations up to date, in the 32-year period from 1985 to 2016, inclusive, agribusiness corporations captured 98 percent of farmers’ revenues—$1.32 trillion out of $1.35 trillion in revenues.  These globally dominant transnational corporations have made themselves the primary beneficiaries of the vast food wealth produced on Canadian farms.  These companies have extracted almost all the value in the “value chain.”  They have left Canadian taxpayers to backfill farm incomes (approximately $100 billion have been transferred to farmers since 1985).  And they have left farmers to borrow the rest (farm debt is at a record high–just under $100 billion).  The massive extraction of wealth by some of the world’s most powerful corporations is the cause of an ongoing farm income crisis.

To leave a comment, click on the graph or this post’s title and then scroll down.

Graph sources: Statistics Canada, CANSIM matrices, and Statistics Canada, Agricultural Economic Statistics, Catalogue No.  21-603-XPE