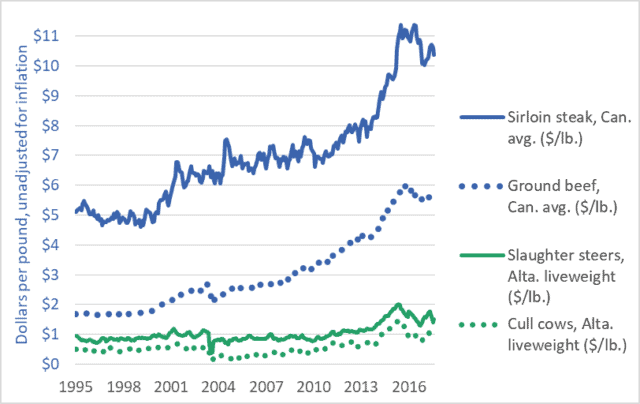
This week’s graph highlights the growing gap between what Canadians pay for beef and what farmers receive for their cattle. The rising blue lines show grocery-store prices for steak and ground beef. The comparatively flat green lines represent the prices farmers and feedlot operators receive for the cattle they sell to beef packers. Steers (castrated male cattle) are more likely to be the source of steaks, while cows are primarily turned into ground beef.
The blue lines show what consumers pay; the green lines show what farmers get. The widening gap between the blue lines and the green lines reveals the amount that packers and retailers take for themselves.
Let’s look first at the dotted lines. The green dotted line shows the per-pound price farmers in Alberta receive for their cows. (prices across Canada are similar.) In the decade-and-a-half before 2010, that price averaged about 50¢. In recent years it has averaged about $1.00. One could say that farmers are receiving an extra 50¢ per pound for their cows. These figures do not take into account rising costs (they are not adjusted for inflation) but we’ll leave that issue aside for now. Note what happens to the blue dotted line: the grocery-store price of ground beef. It more than triples, from about $1.70 per pound to about $5.50. Farmers’ prices increased by 100%, but packers and retailers increased their take by 320%. Farmers’ prices increased by 50¢, but packers and retailers increased their prices by nearly $4.00.
The solid green line shows the price that farmers (or feedlot operators) receive for slaughter-ready steers. The solid blue line is a representative price for grocery-store steaks. If we compare recent years to those before 2013, we see that steer prices have risen by perhaps 50¢ or 60¢ per pound. Over the same period, steak prices have risen by $5.00 or $6.00.
There is little discernible connection between the prices consumers pay and the prices farmers receive. This is true of cattle and beef, but also true of nearly every other farm-retail product pair. For a graph comparing the prices of wheat and bread, click here. Similar “wedge” graphs can be created for corn and cornflakes, hogs and pork chops, and many other farm-retail product pairs.
Food processors, packers, and retailers are choking off the flow of dollars to Canadian farms, with devastating effects. The number of Canadian farms raising cattle has been cut nearly in half in a generation—from 142,000 in 1995 to less than 75,000 today. Moreover, many of these farms reporting cattle are dairy farms (which do sell cattle for slaughter, but support themselves primarily from milk sales). The number of farms classified as “beef cattle ranching and farming, including feedlots” stood at just 36,000 in 2016. Farm debt is a record $100 billion. And the number of young farmers (<35 years of age) today is just one-third the number a generation ago.
Canadians are paying many times over. We’re paying a high price at the store. We’re paying again through our taxes to fund farm support programs—money paid to farmers to backfill for the dollars extracted by powerful transnational packers, processors, and retailers. And we’re paying yet again as our rural economies are hollowed out, our communities decimated, our family farms destroyed, and our nation’s capacity to sustainably produce food is eroded.
Graph sources: Statistics Canada CANSIM Tables 326-0012 and 002-0043.

