New report on agriculture, GHG emissions, climate change, and the farm income crisis

Cover of Tackling the Farm Crisis and the Climate Crisis by Darrin Qualman

How can we reduce agricultural greenhouse gas (GHG) emissions by half by mid-century?  And how can steps to do so help strengthen and safeguard family farms?  These two questions are the focus of a new report written by Darrin Qualman in collaboration with the National Farmers Union (NFU).  The report is entitled Tackling the Farm Crisis and the Climate Crisis: A Transformative Strategy for Canadian Farms and Food Systems and it’s available from the NFU website.

The report looks at the climate crisis and the farm income crisis.  It concludes that our farms’ high emissions and low net incomes have the same cause: overdependence on purchased inputs: fertilizers, chemicals, fuels, etc.

The report shows clearly that the GHG emissions coming out of our farm and food systems are simply the downstream byproducts of the petro-industrial inputs we push in.  “Push in millions of gallons of fossil fuels and they will come out as millions of tonnes of carbon dioxide.  Push in megatonnes of fertilizers and they will come out as megatonnes of nitrous oxide.  As we have doubled and redoubled input use, we have doubled and redoubled the GHG emissions from agriculture,” states the report.  From this novel observation comes an inescapable conclusion: “Any low-emission food system will be a low-input food system.”

The report takes a long-term view and states that “10,000 years of human history makes one thing crystal clear: farming does not create GHG emissions; petro-industrial farm inputs create GHG emissions.”  It goes on to state that “Two things happen when farmers become overdependent on  purchased inputs: emissions go up, and net incomes go down.”

The report is optimistic, however, arguing that solutions to climate problems can also be solutions to farm income problems.  On average, farmers are now retaining just five cents out of every dollar they earn.  The other 95 cents go to pay for inputs—to pay fertilizer, chemical, seed, fuel, and machinery companies and other input and service providers.  But as input use is reduced as a way to reduce emissions, margins and net incomes can go up.  Steps to deal with the climate crisis can also be steps to solve the farm income crisis.

The report explores dozens of practical on-farm measures and government policies that can, taken together, reduce agricultural emissions by half by mid-century.  The report, however, does not underestimate the scale of the task ahead.  It acknowledges that “farmers, other citizens, all sectors, and all levels of government must mobilize, with near-wartime-levels of commitment and effectiveness, to slash emissions.  ”

The report is a hopeful blueprint for the transformation of our farms and food systems.  “We are looking at a future wherein agriculture must increasingly re-merge with nature and culture to create a much more integrated, life-sustaining, and community-sustaining agroecological model of human food provision, nutrition, and health.”

Darrin Qualman worked as Director of Research for the National Farmers Union from 1996 to 2010.  He is the author of the book, published in 2019, Civilization Critical: Energy, Food, Nature, and the Future.

Click HERE to read the report.

Surrounded by Solutions: electric buses, solar panels, high-speed trains, and more

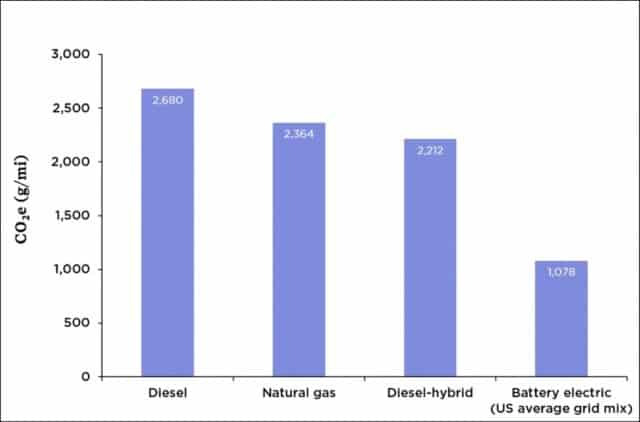
Graph of lifecycle GHG emissions for buses using various energy sources
Lifecycle greenhouse gas emissions for buses using various energy sources

Most North Americans have never seen an electric bus.  Admittedly, momentum is building—some jurisdictions, notably California, have committed to buying only electric transit buses after 2029.  But such buses remain rare in Canada and the United States.  A 2018 report found that just 0.2% of US buses (two in a thousand) were electric, and that tiny percentage is rising very slowly.  New York City provides an example of the modest pace of e-bus adoption—a three-year pilot project, adding just 10 electric buses to its fleet of 5,700.

How’s this for a contrast?  Shenzhen China has 16,000 electric buses—100% of its fleet.  And that city is not unusual in China.  Overall, that country has more than 400,000 electric buses, and is adding 100,000 more each year, with numbers projected to reach one million by 2023.

The graph above shows that electric buses can cut greenhouse gas (GHG) emissions by 60 percent (1,078 grams COequivalent per mile for electric vs. 2,680 grams for diesel).  These low emission values for e-buses take into account that much of North American electricity is generated by burning coal or natural gas.  If we assume a future in which most of our electricity can come from cleaner solar and wind sources then e-buses can reduce emissions by 85 percent compared to diesel.

In addition to having most of the planet’s low-emission buses, China is also leading the world in electric car production and sales.  In 2017, China produced more than half the world’s output of electric cars.  Chinese motorists purchased 580,000 EVs in 2017 while Americans purchased about 200,000 and Canadians 15,000.  Admittedly, many of those Chinese autos are small (think Smart Cars, not Teslas), but that is rapidly changing as Chinese cars become larger and more luxurious.  Indeed, their more modest size can be seen as part of the solution, as the production of small EVs creates lower emissions than the production of large ones.

China is also leading the world in high-speed rail—passenger trains that travel 250 to 350 km/h.  China has added 30,000 kms of new high-speed rail track since 2003 and plans to add another 10,000 kms by 2025, for a total of 40,000 kms—enough to circle the planet.  (For more information on the tremendous potential of high-speed rail, see this blog post, and this one.)

Finally, and this is well known, China dominates the world in solar-panel production and solar-power generation, with production and installation rates several times those in the Americas or EU.  Moreover, China is not the only country shaming us in terms of clean energy adoption: India installed more solar power capacity than the US in 2017 and again in 2018, and far more than Canada.

The four examples above illustrate something important about the current climate crisis: solutions are thick on the ground, but we in North America are simply choosing not to adopt them.  China has made itself the world’s largest solar panel manufacturer; the US has doubled-down on coal, and Canada continues to pin its economic fortunes on the carbon-fuel sector.  China is the world’s largest EV producer; in Canada and the US the best-selling vehicle is the Ford F-150.  China has built tens-of-thousands of kms of passenger-rail track; North Americans have doubled air travel.  We’re walking past mature and promising technologies—choosing to ignore them.

Granted, China has a larger population, but we in North America are far richer.  The combined size of the Canadian and US economies is double that of China’s economy.  Canadian per-capita GDP is five times higher than that of China, and US per-capita GDP is seven times higher.  For every dollar the average Chinese person has to spend on an electric car or solar panels, Canadians and Americans have five to seven dollars.

Moreover, we’re not dependent on foreign technologies or companies.  Canadian Solar, headquartered in Guelph, is one of the six largest solar panel companies in the world.  Bombardier, headquartered in Montreal, is one of the three largest producers of high-speed rail equipment in the world—supplying China with locomotives and rolling stock.  And New Flyer Bus Company, headquartered in Winnipeg, has delivered electric buses to several US and Canadian cities.

We’re not short of high-tech corporations—many world-leading technology companies are headquartered in Canada and the US.  We’re not without technological options.  And we’re not short of funds.  We have extremely promising options and opportunities.  We’re not doomed.  But we are reckless, indulgent, short-sighted, and despicably immoral.  And by continuing to act in the ways we are we will probably manage to doom ourselves.  But that need not be the case.  Solutions abound.

Let’s not dwell on the negative.  Instead, let’s acknowledge the tremendous upside potential and technological possibilities.  Solar panels and electric trains, buses, and cars are solutions close at hand.  Within a decade, North America could host tens-of-thousands of kms of new passenger rail track, hundreds-of-thousands of electric buses, tens-of-millions of electric vehicles, and billions of new solar panels.  This wouldn’t be a complete solution to the climate crisis, but it would be a very good start.

Graph source: Jimmy O’Dea and the Union of Concerned Scientists

Methane and climate: 10 things you should know

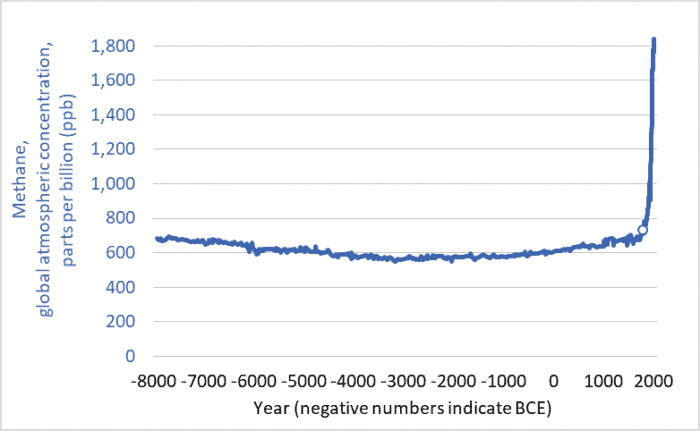
Graph of global atmospheric methane concentrations
Global atmospheric methane concentrations, past 10,000+ years (8000 BCE to 2018 CE)

The graph above shows methane concentrations in Earth’s atmosphere over the past 10,000+ years: 8000 BCE to 2018 CE.  The units are parts per billion (ppb).  The year 1800 is marked with a circle.

Note the ominous spike.  As a result of increasing human-caused emissions, atmospheric methane levels today are two-and-a-half times higher than in 1800.  After thousands of years of relatively stable concentrations, we have driven the trendline to near-vertical.

Here are 10 things you should know about methane and the climate:

1. Methane (CH4) is one of the three main greenhouse gases, along with carbon dioxide (CO2) and nitrous oxide (N2O).

2. Methane is responsible for roughly 20% of warming, while carbon dioxide is responsible for roughly 70%, and nitrous oxide the remaining 10%.

3. Methane is a powerful greenhouse gas (GHG).  Pound for pound, it is 28 times more effective at trapping heat than is carbon dioxide (when compared over a 100-year time horizon, and 84 times as effective at trapping heat when compared over 20 years).  Though humans emit more carbon dioxide than methane, each tonne of the latter traps more heat.

4. Fossil-fuel production is the largest single source.  Natural gas is largely made up of methane (about 90%).  When energy companies drill wells, “frac” wells, and pump natural gas through vast distribution networks some of that methane escapes.  (In the US alone, there are 500,000 natural gas wells, more than 3 million kilometers of pipes, and millions of valves, fittings, and compressors; see reports here and here.)  Oil and coal production also release methane—often vented into the atmosphere from coal mines and oil wells.  Fossil-fuel production is responsible for about 19% of total (human-caused and natural) methane emissions.  (An excellent article by Saunois et al. is the source for this percentage and many other facts in this blog post.)  In Canada, policies to reduce energy-sector methane emissions by 40 percent will be phased in over the next seven years, but implementation of those policies has been repeatedly delayed.

5. Too much leakage makes electricity produced using natural gas as climate-damaging as electricity from coal.  One report found that for natural gas to have lower overall emissions than coal the leakage rate would have to be below 3.2%.  A recent study estimates leakage in the US at 2.3%.  Rates in Russia, which supplies much of the gas for the EU, are even higher.  Until we reduce leakage rates, the advantage of shutting down coal-fired power plants and replacing them with natural gas generation will remain much more modest than often claimed.

6. Domestic livestock are the next largest source of methane.  Cattle, sheep,  and other livestock that graze on grass emit methane from their stomachs through their mouths.  This methane is produced by the symbiotic bacteria that live in the guts of these “ruminants” and enable them to digest grass and hay.  In addition, manure stored in liquid form also emits methane.  Livestock and manure are responsible for roughly 18% of total methane emissions.

7. Rice paddy agriculture, decomposing organic matter in landfills, and biomass burning also contribute to methane emissions.  Overall, human-caused emissions make up about 60% of the total.  And natural sources (wetlands, swamps, wild ruminants, etc.) contribute the remaining 40%.

8. There is lots of uncertainty about emissions.  Fossil fuel production and livestock may be responsible for larger quantities than is generally acknowledged.  The rise in atmospheric concentrations is precisely documented, but the relative balance between sources and sinks and the relative contribution of each source is not precisely known.

9. There is a lot of potential methane out there, and we risk releasing it.  Most of the increase in emissions in recent centuries has come from human systems (fossil fuel, livestock, and rice production; and landfills).  Emissions from natural systems (swamps and wetlands, etc.) have not increased by nearly as much.  But that can change.  If human actions continue to cause the planet to warm, natural methane emissions will rise as permafrost thaws.  (Permafrost contains huge quantities of organic material, and when that material thaws and decomposes in wet conditions micro-organisms can turn it into methane.)  Any such release of methane will cause more warming which can thaw more permafrost and release more methane which will cause more warming—a positive feedback.

Moreover, oceans, or more specifically their continental shelves, contain vast quantities of methane in the form of “methane hydrates” or “clathrates”—ice structures that hold methane stable so long as the temperature remains cold enough.  But heat up the coastal oceans and some of that methane could begin to bubble up to the surface.  And there are huge amounts of methane contained in those hydrates—the equivalent of more than 1,000 years of human-caused emissions.  We risk setting off the “methane bomb“—a runaway warming scenario that could raise global temperatures many degrees and catastrophically damage the biosphere and human civilization.

Admittedly, the methane bomb scenario is unlikely to come to pass.  While some scientists are extremely concerned, a larger number downplay or dismiss it.  Nonetheless a runaway positive feedback involving methane represents a low-probability but massive-impact risk; our day-to-day actions are creating a small risk of destroying all of civilization and most life on Earth.

10. We can easily reduce atmospheric methane concentrations and  attendant warming; this is the good news.  Methane is not like CO2, which stays in the atmosphere for centuries.  No, methane is a “short-lived” gas.  On average, it stays in the atmosphere for less than ten years.  Many natural processes work to strip it out of the air.  Currently, human and natural sources emit about 558 million tonnes of methane per year, and natural processes in the atmosphere and soils remove all but 10 million tonnes.  (again, see Saunois et al.)  Despite our huge increase in methane production, sources and sinks are not that far out of balance.  Therefore, if we stop increasing our emissions then atmospheric concentrations could begin to fall.  We might see significant declines in just decades.  This isn’t the case for CO2, which will stay in the atmosphere for centuries.  But with methane, we have a real chance of reducing atmospheric levels and, as we do so, moderating warming and slowing climate change.

A series of policies focused on minimizing emissions from the fossil-fuel sector (banning venting and minimizing leaks from drilling and fracking and from pipes) could bring the rate of methane creation below the rate of removal and cause atmospheric levels to fall.  A more rational approach to meat production (including curbing over-consumption in North America and elsewhere) could further reduce emissions.  This is very promising news.  Methane reduction represents a “low-hanging fruit” when it comes to moderating climate change.

The methane problem is the climate problem in microcosm.  There are some relatively simple, affordable steps we can take now that will make a positive difference.  But, if we don’t act fast, aggressively, and effectively, we risk unleashing a whole range of effects that will swiftly move our climate into chaos and deprive humans of the possibility of limiting warming to manageable levels.  We can act to create some good news today, or we can suffer a world of bad news tomorrow.

Graph sources:
– United States Environmental Protection Agency (US EPA), “Climate Change Indicators: Atmospheric Concentrations of Greenhouse Gases.
– Commonwealth Scientific and Industrial Research Organisation (CSIRO), “Latest Cape Grim Greenhouse Gas Data.
– National Oceanic and Atmospheric Administration (NOAA), Earth System Research Laboratory, Global Monitoring Division, “Trends in Atmospheric Methane.

There are just two sources of energy

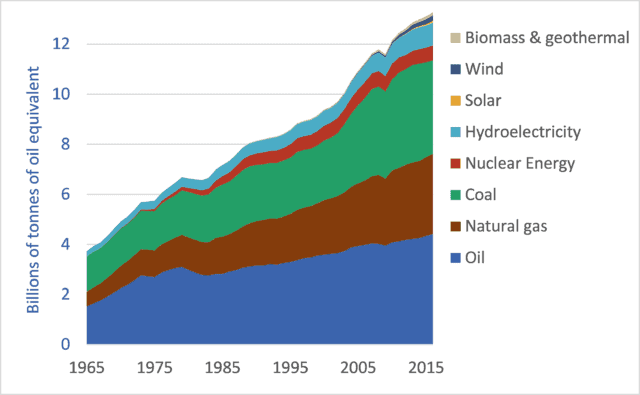
Graph of global primary energy supply by fuel or energy source, 1965-2016
Global primary energy consumption by fuel or energy source, 1965-2016

Our petro-industrial civilization produces and consumes a seemingly diverse suite of energies: oil, coal, ethanol, hydroelectricity, gasoline, geothermal heat, hydrogen, solar power, propane, uranium, wind, wood, dung.  At the most foundational level, however, there are just two sources of energy.  Two sources provide more than 99 percent of the power for our civilization: solar and nuclear.  Every other significant energy source is a form of one of these two.  Most are forms of solar.

When we burn wood we release previously captured solar energy.  The firelight we see and the heat we feel are energies from sunlight that arrived decades ago.  That sunlight was transformed into chemical energy in the leaves of trees and used to form wood.  And when we burn that wood, we turn that chemical-bond energy back into light and heat.  Energy from wood is a form of contemporary solar energy because it embodies solar energy mostly captured years or decades ago, as distinct from fossil energy sources such as coal and oil that embody solar energy captured many millions of years ago.

Straw and other biomass are a similar story: contemporary solar energy stored as chemical-bond energy then released through oxidation in fire.  Ethanol, biodiesel, and other biofuels are also forms of contemporary solar energy (though subsidized by the fossil fuels used to create fertilizers, fuels, etc.).

Coal, natural gas, and oil products such as gasoline and diesel fuel are also, fundamentally, forms of solar energy, but not contemporary solar energy: fossil.  The energy in fossil fuels is the sun’s energy that fell on leaves and algae in ancient forests and seas.  When we burn gasoline in our cars, we are propelled to the corner store by ancient sunlight.

Wind power is solar energy.  Heat from the sun creates air-temperature differences that drive air movements that can be turned into electrical energy by wind turbines, mechanical work by windmills, or geographic motion by sailing ships.

Hydroelectric power is solar energy.  The sun evaporates and lifts water from oceans, lakes, and other water bodies, and that water falls on mountains and highlands where it is aggregated by terrain and gravity to form the rivers that humans dam to create hydro-power.

Of course, solar energy (both photovoltaic electricity and solar-thermal heat) is solar energy.

Approximately 86 percent of our non-food energy comes from fossil-solar sources such as oil, natural gas, and coal.  Another 9 percent comes from contemporary solar sources, mostly hydro-electric, with a small but rapidly growing contribution from wind turbines and solar photovoltaic panels.  In total, then, 95 percent of the energy we use comes from solar sources—contemporary or fossil.  As is obvious upon reflection, the Sun powers the Earth.

The only major energy source that is not solar-based is nuclear power: energy from the atomic decay of unstable, heavy elements buried in the ground billions of years ago when our planet was formed.  We utilize nuclear energy directly, in reactors, and also indirectly, when we tap geothermal energies (atomic decay provides 60-80 percent of the heat from within the Earth).  Uranium and other radioactive elements were forged in the cores of stars that exploded before our Earth and Sun were created billions of years ago.  The source for nuclear energy is therefore not solar, but nonetheless stellar; energized not by our sun, but by another.  Our universe is energized by its stars.

There are two minor exceptions to the rule that our energy comes from nuclear and solar sources: Tidal power results from the interaction of the moon’s gravitational field and the initial rotational motion imparted to the Earth; and geothermal energy is, in its minor fraction, a product of residual heat within the Earth, and of gravity.  Tidal and geothermal sources provide just a small fraction of one percent of our energy supply.

Some oft-touted energy sources are not mentioned above.  Because some are not energy sources at all.  Rather, they are energy-storage media.  Hydrogen is one example.  We can create purified hydrogen by, for instance, using electricity to split water into its oxygen and hydrogen atoms.  But this requires energy inputs, and the energy we get out when we burn hydrogen or react it in a fuel cell is less than the energy we put in to purify it.  Hydrogen, therefore, functions like a gaseous battery: energy carrier, not energy source.

Understanding that virtually all energy sources are solar or nuclear in origin reduces the intellectual clutter and clarifies our options.  We are left with three energy supply categories when making choices about our future:
– Fossil solar: oil, natural gas, and coal;
– Contemporary solar: hydroelectricity, wood, biomass, wind, photovoltaic electricity, ethanol and biodiesel (again, often energy-subsidized from fossil-solar sources); and
– Nuclear.

Knowing that virtually all energy flows have their origins in our sun or other stars helps us critically evaluate oft-heard ideas that there may exist undiscovered energy sources.  To the contrary, it is extremely unlikely that there are energy sources we’ve overlooked.  The solution to energy supply constraints and climate change is not likely to be “innovation” or “technology.” Though some people hold out hope for nuclear fusion (creating a small sun on Earth rather than utilizing the conveniently-placed large sun in the sky) it is unlikely that fusion will be developed and deployed this century.  Thus, the suite of energy sources we now employ is probably the suite that will power our civilization for generations to come.  And since fossil solar sources are both limited and climate-disrupting, an easy prediction is that contemporary solar sources such as wind turbines and solar photovoltaic panels will play a dominant role in the future.


Graph sources: BP Statistical Review of World Energy 2017


Carbon tax will not cause fossil fuel use to fall: Canada’s NEB

Graph of Canadian fossil fuel use and NEB projections to 2040
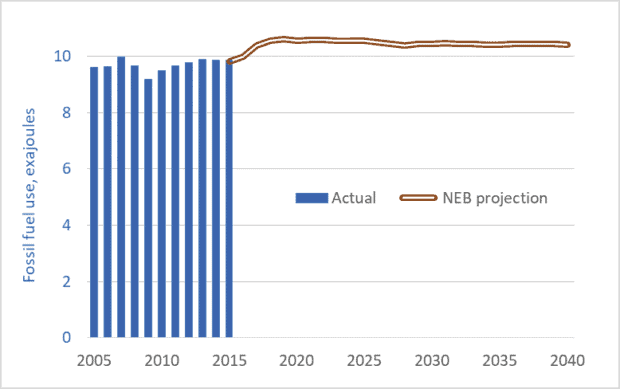
Canadian fossil fuel use, historic and projections to 2040

The graph above is based on data from a recent report by Canada’s National Energy Board (NEB)—a federal government agency.  The October 26 report, Canada’s Energy Future 2017, predicts that Canadians will be consuming fossil fuels at the same rate in 2040 as we are today.  The NEB is projecting that fossil fuel use will not fall, nor will attendant greenhouse gas (GHG) emissions.

The graph’s blue bars show Canadian fossil fuel use over the past 11 years.  The brown line shows the NEB’s projections for the future.  The units, exajoules, are not important.  What is important is that the NEB predicts no drop in fuel consumption.

Most important, is that the NEB’s projections take into account the federal government’s carbon tax.  Ottawa has announced that the provinces must impose a carbon tax of $10 per tonne in 2018, escalating to $50 per tonne by 2022.  All provinces must impose a tax, or some equivalent carbon-pricing scheme.

At the Paris climate talks in 2015, Canada joined other nations in committing to limit the global average temperature increase to 2.0 degrees C (relative to pre-industrial levels).  To help achieve that goal, Canada has made an international commitment to reduce its GHG emissions by 30 percent (relative to 2005 levels) by 2030.  The NEB is, in effect, saying that Canada will fail to meet its commitment of a 30 percent reduction; the carbon tax, along with all other measures announced so far, will not cause a decline in fossil fuel use or emissions.

The preceding should surprise no one.  The federal government’s carbon tax starts out at $10 per tonne of carbon—equivalent to about 2¢ per litre of gasoline.  Over the next half-decade, it rises to $50 per tonne—about 11¢ per litre.  Many Canadians do not know the price of gasoline to the nearest dime.  And gasoline prices over the past year were down as much as 40¢ compared to three years ago.  An 11¢ per litre carbon tax is not going to cause gasoline consumption to fall.  Similarly modest taxes on other fuels will likewise prove ineffective.

Canadians need to understand that they are being deceived.  Politicians—eager for re-election and afraid of hard conversations with voters—are understating the magnitude of the climate crisis and overestimating the effectiveness of our actions to counter the threat.

How do we actually reduce fossil fuel use, cut emissions, and stabilize the climate?  A carbon tax is needed, but it must be much higher: $200 to $300 per tonne—equivalent to 50¢ to 75¢ per litre of gasoline.  But such a tax is unbearable for citizens (and politicians) unless 100 percent of the total tax collected is rebated back to citizens on a per-capita basis.  We need a carbon-tax-and-refund system.  Under such a system, we would all pay taxes on gasoline, home heating fuel, etc. and pay indirectly on the energy embedded in our products.  Goods that required a lot of energy to produce or transport would cost more.  But offsetting these new costs, we would receive back all the carbon tax money collected, on a per-capita basis.  Thus, if a person’s energy consumption is below average, he or she would finish the year money ahead—his or her per-capita refund would exceed the carbon taxes paid.  On the other hand, someone who wants to drive a Hummer and heat and cool a huge home will come out money behind.  Another way of thinking about this tax-and-refund system is that it transfers money to those doing the right things from those doing the wrong things.  And the former group can take their carbon tax refunds and invest them in home energy retrofits, solar panels, and other emission-reduction measures, setting the stage for even larger carbon tax savings next year.

The NEB is telling us we’re not on track.  But we can change course.  Bold and rapid policy action now can reduce emissions by 30 percent and help limit temperature increases to 2 degrees.  But we must act.

Graph source: National Energy Board