Greta vs. growth

Graph of the size of the global economy (Gross World Product) historic
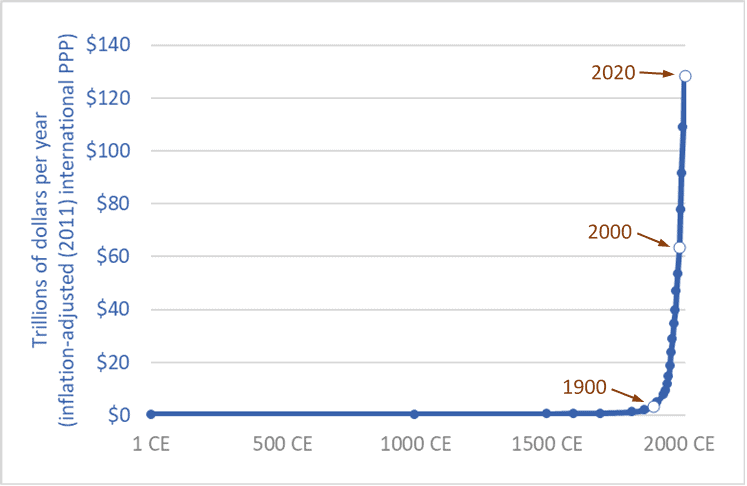
The size of the global economy (Gross World Product) over the long term, 1 CE – 2020 CE

“People are suffering.  People are dying.  Entire ecosystems are collapsing.  We are in the beginning of a mass extinction, and all you can talk about is money and fairy tales of eternal economic growth.  How dare you!”  So spake Greta Thunberg at the United Nations on September 23rd, 2019.

Thunberg, a sixteen-year-old without a university education, has had the insight, clarity, and courage to say what ten-billion-dollars worth of Ph.D. economists haven’t: that continued economic growth is, at best, unsustainable and probably much worse: a malignant illusion driving us to destroy our biosphere, civilization, and future.  The project of making the current global economy four or eight times larger is a suicide pact.

The graph above places our 21st century economy in its long-term context.  It shows the size of the global economy (Gross World Product) from 1 CE to 2020.  The units are trillions of US/international dollars adjusted for inflation (constant 2011 dollars).  The main source is the World Bank, with historical data from Angus Maddison.  (Pre-20th century values are, by necessity, estimates by Maddison.)

The years 1900, 2000, and 2020 are highlighted.  Sometime in 2020 the size of the global economy will surpass 127 trillion dollars.  When it does, it will be twice as large as it was in 2000.  The economy will have doubled in size in just 20 years.  This shouldn’t be a surprise.  Sustained growth rates of 3.5 percent leads to a doubling every 20 years.  (Recall the Rule of 70.)

Going forward, if we maintain current rates of growth—three to four percent annually—the economy will be twice as large again by 2040 or soon after—making it four times larger than in 2000.  Earth’s atmosphere, oceans, land, and biosphere will be hosting four 2000-sized economies.

And by 2060 or 2070, another doubling will bring the global economy to eight times its 2000 level.  And there’ll still be more than enough time left in this century to double it again—at least a 16-fold increase in size in a single century, if we stay the course.  If we accomplish this, we will be reprising the 18-fold increase seen during the 20th century.

Of course, we won’t do this—we won’t make the global economy 8 or 16 times larger.  Within a generation or two nearly everyone on the planet will be living in a post-growth economy: either because we’ve had the wisdom to end runaway exponential growth and put the biosphere first, or because we have not.

The end of growth, inescapable in the medium term, will bring numerous problems, such as how will we deal with the equity claims of the poor if we can no longer rely on the convenient fictions of “a rising tide raises all boats” and “anyone (everyone?) can grow up to be rich.”  While the end of growth must come for nearly all within a few decades, it must come first for those of us who are richest, so that growth can continue in places where people are poorer.  Those of us who enjoy jet vacations need to step off the growth escalator first so that growth can continue for others and deliver to them running water and refrigerators.  The end of growth casts into sharp relief a series of moral problems.

But the end of growth will also solve many problems.  We will be forced to take less of our economy’s productivity and bounty in the form of consumer products and more in the form of free time and low-emission leisure—more time with family, more time with friends drinking coffee or wine, more time with culture and nature; more discussion, poetry, romance, literature, and contemplation.  Most of the people in the fast-expanding (-metasticizing?) global middle class are living high-stress, low-quality, time-impoverished lives.  Stepping off the growth escalator can be part of a larger civilizational, cultural, and spiritual shift in which we rediscover meaning and purpose beyond getting and spending.

Thunberg is neither sage nor prophet.  And one need be neither to see what is absolutely, inescapably obvious: growth must and will soon end.  But we have a choice: We can deny the fact of growth’s imminent end and continue in the fairy tale and massively deplete and damage the planet in a last frenzied attempt to squeeze out one or two more doublings, or we can be as mature as a sixteen-year-old, admit the obvious, get on with the needed changes, and reap the benefits of slower, saner, more sustainable, more enjoyable lives.

Sources for graph:
– 
World Bank, Databank website: “GDP, PPP (constant 2011 international $)”
– 
Angus Maddison, The World Economy, Volume 1: A Millennial Perspective (Paris: OECD, 2001); Angus Maddison, Contours of the World Economy, 1–2030 AD: Essays in Macro-Economic History (Oxford: Oxford University Press, 2007)



Another trillion tonnes: 250 years of global material use data

Graph of Global materials use 1850-2100
Global materials use, 1850-2100

Want to understand your society and economy and the fate of petro-industrial civilization?  If so, don’t “follow the money.”  The stock market casino, quantitative easing, derivatives and other “financial innovations,” and the trillions of e-dollars that flit through the global monetary system each day obscure the real economy—the production and destruction of actual wealth: mining, farming, processing, transport, manufacturing, consumption, disposal.  To understand where we are and where we may be going, we must follow more tangible flows—things that are real.  We must follow the oil, coal, steel, concrete, grain, copper, fertilizers, salt, gravel, and other materials.

Our cars, homes, phones, foods, fuels, clothes, and all the other products we consume or aspire to are made out of stuff—out of materials, out of wood, iron, cotton, etc.   And our economies consume enormous quantities of those materials—tens-of-billions of tonnes per year.

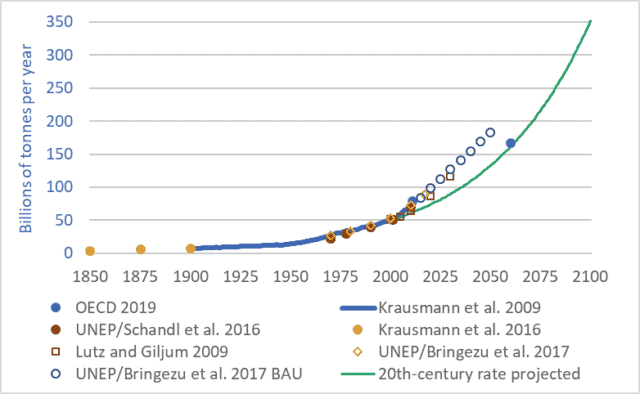
The graph above shows 250 years of actual and projected material flows through our global economy.  The graph may initially appear complicated, because it brings together seven different sources and datasets and includes a projection to the year 2100.  But the details of the graph aren’t important.  What is important is the overall shape: the ever-steepening upward trendline—the exponential growth.

In 1900, global material flows totalled approximately 7 billion tonnes.  The technical term for these material flows is “utilized materials”—the stuff we dig out of mines, pump up from oil or natural gas wells, cut down in forests, grow on farms, catch from the sea, dig out of quarries, and otherwise appropriate for human uses.  These tonnages do not include water, nor do they include unused overburden, but they do include mine tailings, though this last category adds just a few percent to the total.

Between 1900 and 2000, global material tonnage increased sevenfold—to approximately 49 billion tonnes (Krausman et al. 2009).  Tonnage rose to approx. 70 billion tonnes by 2010 (UNEP/Schandl 2016), and to approx. 90 billion tonnes by 2018 (UNEP/Bringezu 2018).  At the heart of our petro-industrial consumerist civilization is a network of globe-spanning conveyors that, each second, extract and propel nearly 3,000 tonnes of materials from Earth’s surface and subsurface to factories, cities, shops, and homes, and eventually on to landfills, rivers and oceans, and the atmosphere.  At a rate of a quarter-billion tonnes per day we’re turning the Earth and biosphere into cities, homes, products, indulgences, and fleeting satisfactions; and emissions, by-products, toxins, and garbage.

And these extraction, consumption, and disposal rates are projected to continue rising—to double every 30 to 40 years (Lutz and Giljum 2009).  Just as we increased material use sevenfold during the 20th century we’re on track to multiply it sevenfold during the 21st.  If we maintain the “normal” economic growth rates of the 20th century through the 21st we will almost certainly increase the volume and mass of our extraction, production, and disposal sevenfold by 2100.

But 2100 is a long way away.  Anything could happen by then.  Granted.  So let’s leave aside the long-term and look only at the coming decade.  Material throughput now totals about 90 billion tonnes per year, and is projected to rise to about 120 billion tonnes per year over the coming decade.  For ease of math, let’s say that the average over the coming decade will be 100 billion tonnes per year.  That means that between 2019 and 2029 we will extract from within the Earth and from the biosphere one trillion tonnes of materials: coal, oil, wood, fish, nickel, aluminum, chromium, uranium, etc.  …one trillion tonnes.  And we’ll send most of that trillion tonnes on into disposal in the ground, air, or water—into landfills, skyfills, and seafills.  In the coming decade, when you hear ever-more-frequent reports of the oceans filling with plastic and the atmosphere filling with carbon, think of that trillion tonnes.

Postscript: “dematerialization”

At conferences and in the media there’s a lot of talk of “dematerialization,” and its cousin “decarbonization.”  The idea is this: creating a dollar of economic activity used to require X units of energy or materials, but now, in countries such as Canada and the United States, creating a dollar of economic activity requires only two-thirds-X units.  Pundits and officials would have us believe that, because efficiency is increasing and less material and energy are needed per dollar, the economy is being “dematerialized.”  They attempt to show that the economy can grow and grow but we need not use more materials or energy.  Instead of consuming heavy steel cars, we will consume apps, massages, and manicures.  But this argument is wrong.  Global material and energy use increased manyfold during the 20th century.  The increases continue.  A business-as-usual scenario will see energy and materials use double every 30 to 40 years.  And just because the sizes of our economies, measured in abstract currencies, are growing faster, this does not change the fact that our use of energy and materials is growing.  “Dematerialization” has no useful meaning in a global economy in which we are using 90 billion tonnes of materials per year and projecting the use of 180 billion tonnes by 2050.  Our rate of extraction and consumption of materials is rising; the fact that the volume of dollar flows is rising faster is merely a distraction.

Sources for material flow tonnage:

Fridolin Krausmann et al., “Growth in Global Materials Use, GDP, and Population During the 20th Century,” Ecological Economics 68, no. 10 (2009).

Christian Lutz and Stefan Giljum, “Global Resource Use in a Business-as-Usual World: Updated Results from the GINFORS Model,” in Sustainable Growth and Resource Productivity: Economic and Global Policy Issues, ed. Bleischwitz et al. (Sheffield, UK: Greenleaf Publishing, 2009).

Stefan Giljum et al., Sustainable Europe Research Institute (SERI), “Resource Efficiency for Sustainable Growth: Global Trends and European Policy Scenarios,” background paper, delivered Sept. 10, 2009, in Manila, Philippines.

Julia Steinberger et al., “Global Patterns of Materials Use: A Socioeconomic and Geophysical Analysis,” Ecological Economics 69, no. 5 (2010).

UN Environmental Programme (UNEP) and H. Schandl et al., Global Material Flows and Resource Productivity: An Assessment Study of the UNEP International Resource Panel (Paris: UNEP, 2016).

Krausmann et al., “Long-term Trends in Global Material and Energy Use,” in Social Ecology: Society-Nature Relations across Time and Space, ed. Haberl et al. (Switzerland: Springer, 2016).

United Nations Environment Programme (UNEP), International Resource Panel, and Stefan Bringezu et al., Assessing Global Resource Use: A Systems Approach to Resource Efficiency and Pollution Reduction (Nairobi: UNEP, 2017).

Organization for Economic Cooperation and Development (OECD), Global Material Resources Outlook to 2060: Economic Drivers and Environmental Consequences (Paris: OECD Publishing, 2019)

If you’re for pipelines, what are you against?

Graph of Canadian greenhouse gas emissions, by sector, 2005 to 2039
Canadian greenhouse gas emissions, by sector, 2005 to 2030

As Alberta Premier Notley and BC Premier Horgan square off over the Kinder Morgan / Trans Mountain pipeline, as Alberta and then Saskatchewan move toward elections in which energy and pipelines may be important issues, and as Ottawa pushes forward with its climate plan, it’s worth taking a look at the pipeline debate.  Here are some facts that clarify this issue:

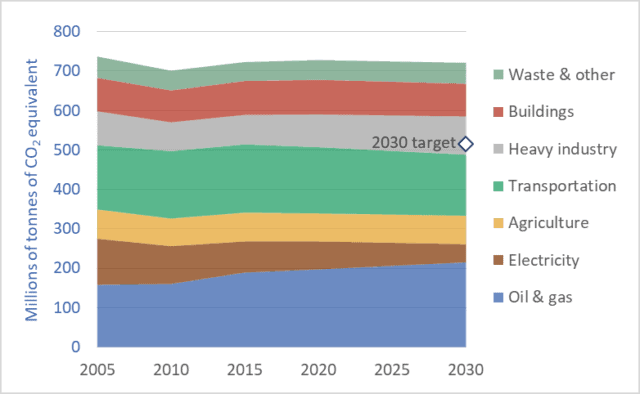
1.  Canada has committed to reduce its greenhouse gas (GHG) emissions by 30 percent (to 30 percent below 2005 levels by 2030).

2.  Oil production from the tar sands is projected to increase by almost 70 percent by 2030 (From 2.5 million barrels per day in 2015 to 4.2 million in 2030).

3.  Pipelines are needed in order to enable increased production, according to the Canadian Association of Petroleum Producers (CAPP) and many others.

4.  Planned expansion in the tar sands will significantly increase emissions from oil and gas production.  (see graph above and this government report)

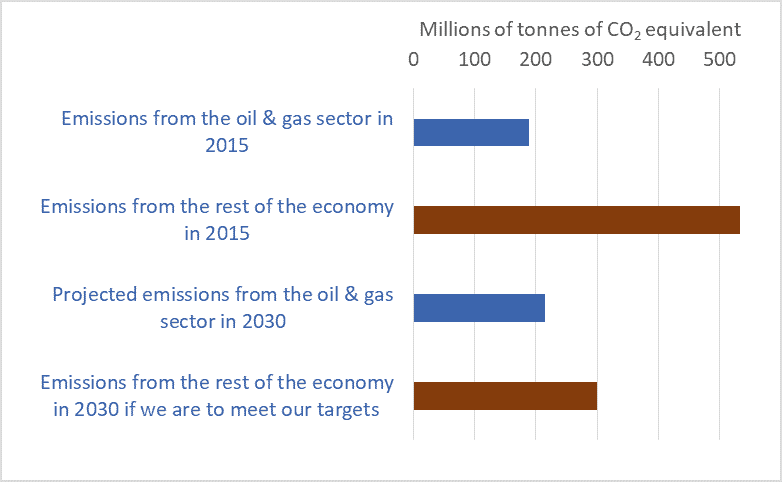
5.  Because there’s an absolute limit on our 2030 emissions (515 million tonnes), if the oil and gas sector is to emit more, other sectors must emit less.  To put that another way, since we’re committed to a 30 percent reduction, if the tar sands sector reduces emissions by less than 30 percent—indeed if that sector instead increases emissions—other sectors must make cuts deeper than 30 percent.

The graph below uses the same data as the graph above—data from a recent report from the government of Canada.  This graph shows how planned increases in emissions from the Alberta tar sands will force very large reductions elsewhere in the Canadian economy.

Graph of emissions from the Canadian oil & gas sector vs. the rest of the economy, 2015 & 2030
Emissions from the Canadian oil & gas sector vs. the rest of the economy, 2015 & 2030

Let’s look at the logic one more time: new pipelines are needed to facilitate tarsands expansion; tarsands expansion will increase emissions; and an increase in emissions from the tarsands (rather than a 30 percent decrease) will force other sectors to cut emissions by much more than 30 percent.

But what sector or region or province will pick up the slack?  Has Alberta, for instance, checked with Ontario?  If Alberta (and Saskatchewan) cut emissions by less than 30 percent, or if they increase emissions, is Ontario prepared to make cuts larger than 30 percent?  Is Manitoba or Quebec?  If the oil and gas sector cuts by less, is the manufacturing sector prepared to cut by more?

To escape this dilemma, many will want to point to the large emission reductions possible from the electricity sector.  Sure, with very aggressive polices to move to near-zero-emission electrical generation (policies we’ve yet to see) we can dramatically cut emissions from that sector.  But on the other hand, cutting emission from agriculture will be very difficult.  So potential deep cuts from the electricity sector will be partly offset by more modest cuts, or increases, from agriculture, for example.

The graph at the top shows that even as we make deep cuts to emissions from electricity—a projected 60 percent reduction—increases in emissions from the oil and gas sector (i.e. the tar sands) will negate 100 percent of the progress in the electricity sector.  The end result is, according to these projections from the government of Canada, that we miss our 2030 target.  To restate: according to the government’s most recent projections we will fail to meet our Paris commitment, and the primary reason will be rising emissions resulting from tarsands expansion.  This is the big-picture context for the pipeline debate.

We’re entering a new era, one of limits, one of hard choices, one that politicians and voters have not yet learned to navigate.   We are exiting the cornucopian era, the age of petro-industrial exuberance when we could have everything; do it all; have our cake, eat it, and plan on having two cakes in the near future.  In this new era of biophysical limits on fossil fuel combustion and emissions, on water use, on forest cutting, etc. if we want to do one thing, we may be forced to forego something else.  Thus, it is reasonable to ask: If pipeline proponents would have us expand the tar sands, what would they have us contract?

Graph sources: Canada’s 7th National Communication and 3rd Biennial Report, December 2017

Geoengineering: 12 things you need to know

Graphic showing various geoengineering methods

The following draws upon extensive research by ETC Group.  I have been privileged to serve on ETC’s Board of Directors for several years. 

1.  What is “geoengineering”?  It is the intentional, largescale, technological manipulation of Earth’s systems.  Geoengineering is usually discussed as a solution to climate change, but it could also be used to attempt to de-acidify oceans or fix ozone holes.  Here, I’ll concentrate on climate geoengineering.

2.  There are two main types of climate geoengineering:
i. Technologies to partially shade the sun in order to reduce warming (called “solar radiation management” or SRM).  For example, high-altitude aircraft could be used to dump thousands of tonnes of sulphur compounds into the stratosphere to form a reflective parasol over the Earth.
ii. Attempts to pull carbon dioxide (CO2) out of the air.  One proposal is ocean fertilization.  In theory, we could dump nutrients into the ocean to spur plankton/algae growth.  As the plankton multiply, they would take up atmospheric CO2 that has dissolved in the water.  When they die, they would sift down through the water column, taking the carbon to the ocean floor.

3.  The effects of geoengineering will be uneven and damaging.  For example, sun-blocking SRM technologies might lower the global average temperature, but regional temperature changes would probably be uneven.  Other geoengineering techniques—cloud whitening and weather modification—could similarly alter temperatures in some parts of the planet relative to others.  And if we change relative regional temperatures we would also shift wind and rainfall patterns.  Geoengineering will almost certainly cause droughts, storms, and floods.  Going further, however, all droughts, storms, and floods (even those that might have occurred in the absence of geoengineering) could come to be seen as caused by geoengineering and the governments controlling those climate interventions.  If we go down this path, there will no longer be any “acts of God”; weather will become a product of government.

4.  These technologies are dangerous in other ways.  Seeding the stratosphere with sulphur particles could catalyze ozone depletion.  Shifts in rain and temperature patterns may cause shifts in ecosystems and wildlife habitats.  Multiplying plankton biomass may affect fish species distribution and biodiversity.  Moreover, as with any enormously powerful technology, it is simply impossible to foresee the full range of unintended consequences.

5.  Geoengineering is unilateral, undemocratic, inequitable, and unjust.  In a geoengineered world, who will control the global thermostat?  Solar radiation management and similar schemes will inevitably be controlled by the dominant governments and corporations—a rich-nation “coalition of the dimming.”  But benefits and costs will be distributed unequally, creating winners and losers.  Where will less powerful nations appeal if they find themselves on the losing end?  Our climate interventions will be calibrated to maximize benefits to rich nations: the same countries that have benefited most from fossil fuel combustion and that have caused the climate crisis.  We appear to be contemplating a triple injustice: poor nations will be denied their fair share of the benefits of fossil fuel use; hit hardest by climate change; and left as collateral damage from geoengineering.  Finally, geoengineering is undemocratic in another way.  It is a choice to pursue technical interventions rather than social or political reforms.  It reveals that many governments and elites would risk damaging the stratosphere, hydrosphere, and biosphere rather than risk difficult conversations with voters, CEOs, or shareholders.

6.  Geoengineering embodies and proliferates a certain worldview: masculine, nature-dominating, imperialistic, managerial and technocratic, hostile to limits, and hubristic.

7.  Geoengineering will create conflicts.  Because technologies such as SRM are transboundary and have the potential to shift weather patterns they can lead to charges that other nations are stealing rain and, ultimately, food.  To get a sense of the potential for conflict, imagine the US reaction to unilateral deployment of weather- and climate-altering technologies by Russia or China.

8.  It is untestable.  Small-scale experiments with SRM or similar technologies will not reveal potential side-effects.  These will only become evident after planet-scale deployment, and perhaps years after the fact, as weather systems move toward new equilibria.

9.  Deployment may be irreversible.  Once we start we might not be able to stop.  Geoengineering would probably proceed alongside continued greenhouse gas (GHG) emissions.  But if we deploy sun-blocking technologies and simultaneously push atmospheric CO2 levels past 500 or 600 parts per million, we wouldn’t be able to terminate our dimming programs, no matter how damaging the effects of long-term geoengineering are revealed to be.  If we did stop, high GHG levels would trigger sudden and dramatic warming.  We risk locking ourselves into untestable, unpredictable, uncontrollable, and planet-altering technologies.

10. Can geoengineering “buy us time”?  Proponents argue that these technologies can buy us some time: time humanity needs in order to ramp up emissions reductions.  But geoengineering is more likely to buy time for the status quo, to prolong unsustainable fossil fuel production and energy inefficiency, and to blunt and delay urgent and effective action.  The effect of geoengineering is not so much to buy time as to waste time.

11. There will be attempts to pressure us into accepting geoengineering.  Geoengineering proponents may soon raise the alarm and claim that we must accept these risky technologies or face even worse damage from climate change.  “Desperate times call for desperate measures,”  they will say.  From these same sources may come arguments that geoengineering is necessary to hold global average temperature increases below 1.5 or 2 degrees and thus spare the world’s poorest and most vulnerable peoples.  Such arguments would be both ironic and duplicitous.  The same government and corporate leaders who today deny or downplay climate change, or deny the need for rapid action to cut emissions, may tomorrow be the ones raising the alarm, and claiming that there is no solution other than geoengineering.  They may pivot from claiming that there is no problem to claiming that there is no alternative.

12. Geoengineering will be pushed by the rich and powerful.  A growing number of corporations, elites, and politicians see the solution to climate change, not in emissions reduction, but in massive techno-interventions into the atmosphere or oceans to block the sun or suck up carbon.  When he was CEO of Exxon, US Secretary of State Rex Tillerson said of climate change: “It’s an engineering problem, and it has engineering solutions.”  Exxon employs many geoengineering proponents and theorists.  Former executive at oil company BP and former Under-Secretary for Science in the Obama administration Steven Koonin is lead author of a report entitled Climate Engineering Responses to Climate Emergencies.   Virgin Airlines CEO Richard Branson offered a $25 million prize to anyone who could solve climate change by geoengineering.   Bill Gates and other Microsoft billionaires are funding geoengineering research.  Newt Gingrich is the former speaker of the US House of Representatives and a Vice Chairman of Donald Trump’s transition team.  His views on geoengineering are worth quoting because they may be representative of a growing sentiment among political and corporate leaders.  Gingrich wrote in a 2008 fundraising letter:

“[T]he idea behind geoengineering is to release fine particles in or above the stratosphere that would then block a small fraction of the sunlight and thus reduce atmospheric temperature.

… Instead of imposing an estimated $1 trillion cost on the economy …, geoengineering holds forth the promise of addressing global warming concerns for just a few billion dollars a year.  Instead of penalizing ordinary Americans, we would have an option to address global warming by rewarding scientific innovation.

My colleagues at the American Enterprise Institute are taking a closer look at geoengineering, and we should too.  …

Our message should be: Bring on the American Ingenuity.  Stop the green pig.”


For reasons outlined above and many others, we must not go down the path of geoengineering.  These technologies—massive government and corporate interventions into the core flows and structures of the atmosphere, hydrosphere, and biosphere—are among the most dangerous initiatives ever devised.  Geoengineering must be banned; it is untestable, uncontrollable, unjust, probably irreversible, and potentially devastating.  There exist better, safer options: rapid and dramatic emissions reductions; and a government-led mobilization toward a transformation of global energy, transport, industrial, and food systems.


A critically important solution to our climate crisis (and other crises)

Reconstructed wreckage of TWA Flight 800
US National Transportation Safety Board (NTSB) reconstruction of wreckage from TWA Flight 800

Ronald Wright’s A Short History of Progress is available as a book and as a five-part audio series—the 2004 CBC Massey Lectures.  (Listen here.)  In both its written and oral forms, A Short History of Progress is an accessible, eye-opening tour of humanity’s long historic journey—a look at the big picture and the long term.  It is aphoristic and packed with insights.  But one idea stands out.  Wright gets at this important idea by using the analogy of plane crashes.

Air travel today is very safe.  Mile for mile, your chances of being killed or injured while traveling on a commercial jetliner are about one one-hundredth your chances of suffering the same fate in your own car.  In 2016, zero people died in crashes of a US-based airlines operating anywhere in the world—the seventh year in a row that this was true (source here).

There’s a reason that airliners have become so safe: after every crash, well-resourced teams of highly-trained aviation experts are tasked with determining why a crash occurred, and once the cause is known the entire global aviation system implements changes to ensure that no plane in the future crashes for the same reasons.

Government agencies and airlines often expend enormous efforts to determine the cause of a crash.  The photograph above is of the reconstructed wreckage of TWA Flight 800, a Boeing 747 that crashed in 1996 after its fuel tank exploded, splitting the plane apart just ahead of the wings.  The plane crashed into the ocean off the coast of New York.  All 230 people aboard died.

The debris field covered several square miles.  In a massive effort, approximately 95 percent of the plane’s wreckage was salvaged from the sea.  The plane was painstakingly reconstructed.  And using the reconstructed plane as well as the flight data and cockpit voice recorders, the cause of the failure was traced back to a short circuit in wiring connected to the “fuel quantity indication system” in the centre fuel tank.  As a result of this investigation, changes were made to planes around the world to ensure that no similar crashes would occur.  As a result of crash investigations around the world, airlines and aircraft makers have made thousands of changes to airplane construction, crew training, air traffic control, airport security, airline maintenance, and operating procedures.  The results, as noted above, have been so successful that some years now pass without, for instance, a single fatality on a US airline.

Ronald Wright argues that the ruins and records of fallen civilizations can be investigated like airplane crash sites, and we can use the lessons we learn to make changes that can safeguard our current global civilization against similar crashes.  He writes that these ruined cities and civilizations are like “fallen airliners whose black boxes can tell us what went wrong” so that we can “avoid repeating past mistakes of flight plan, crew selection, and design.”  When Wright talks metaphorically about “flight plan,” consider our own plan to increase the size of the global economy tenfold, or more, this century.  And when he talks about crew selection, think about who’s in the cockpit in the United States.

Wright continues: “While the facts of each case [of civilizational collapse] differ, the patterns are alarmingly … similar.  We should be alarmed by the predictability of our mistakes but encouraged that this very fact makes them useful for understanding what we face today.”

Wright urges us to deploy our archaeologists, historians, anthropologists, ecologists, and other experts as crash-scene investigators—to read “the flight recorders in the wreckage of crashed civilizations,” and to take what we learn there and make changes to our own.  It is good advice.  It is, perhaps, the best advice our global mega-civilization will ever receive. 

While the crash of a jetliner may kill hundreds, the crash of our mega-civilization could kill billions.  And as more passengers pile in, as our global craft accelerates, and as the reading on the fuel-gauge drops and our temperature gauge rises, we should become more and more concerned about how we will keep our civilizational jetliner aloft through the storms to come.

Photo source: Newsday 

Everything must double: Economic growth to mid-century

Graph of GDP of the world's largest economies, 2016 vs 2050
Size of the world’s 17 largest economies, 2016, and projections for 2050

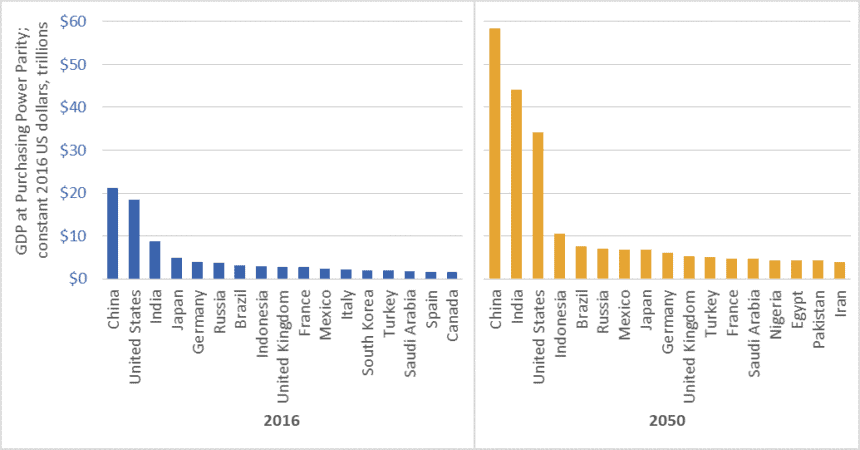
In February 2017, global accounting firm PricewaterhouseCoopers (PwC) released a report on economic growth entitled The Long View: How will the Global Economic Order Change by 2050?  The graph above is based on data from that report.  (link here)  It shows the gross domestic product (GDP) of the largest economies in the world in 2016, and projections for 2050.  The values in the graph are stated in constant (i.e., inflation adjusted) 2016 dollars.

PwC projects that China’s economy in 2050 will be larger than the combined size of the five largest economies today—a list that includes China itself, but also the US, India, Japan, and Germany.

Moreover, the expanded 2050 economies of China and India together ($102.5 trillion in GDP) will be almost as large as today’s global economy ($107 trillion).

We must not, however, simply focus on economic growth “over there.”  The US economy will nearly double in size by 2050, and Americans will continue to enjoy per-capita GDP and consumption levels that are among the highest in the world.  The size of the Canadian economy is similarly projected to nearly double.   The same is true for several EU countries, Australia, and many other “rich” nations.

Everything must double

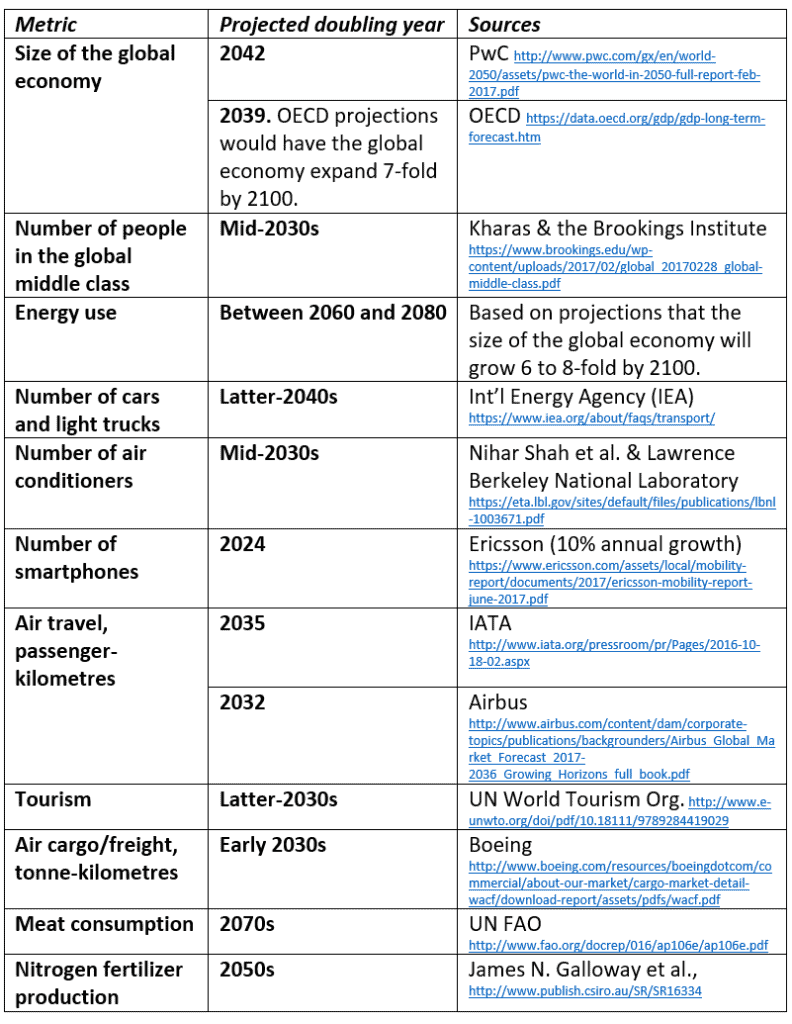
PwC’s report tells us that between now and 2050, the size of the global economy will more than double.  Other reports concur (See the OECD data here).  And this doubling of the size of the global economy is just one metric—just one aspect of the exponential growth around us.  Indeed, between now and the middle decades of this century, nearly everything is projected to double.  This table lists just a few examples.

Table of projected year of doubling for various energy, consumption, transport, and other metrics
Projected year of doubling for selected energy, consumption, and transport metrics

At least one thing, however, is supposed to fall to half

While we seem committed to doubling everything, the nations of the world have also made a commitment to cut greenhouse gas (GHG) emissions by half by the middle decades of this century.  In the lead-up to the 2015 Paris climate talks, Canada, the US, and many other nations committed to cut GHG emissions by 30 percent by 2030.  Nearly every climate scientist who has looked at carbon budgets agrees that we must cut emissions even faster.  To hold temperature increases below 2 degrees Celsius relative to pre-industrial levels, emissions must fall by half by about the 2040s, and to near-zero shortly after.

Is it rational to believe that we can double the number of cars, airline flights, air conditioners, and steak dinners and cut global GHG emissions by half?

To save the planet from climate chaos and to spare our civilization from ruin, we must—at least in the already-rich neighborhoods—end the doubling and redoubling of economic activity and consumption.  Economic growth of the magnitude projected by PwC, the OECD, and nearly every national government will make it impossible to cut emissions, curb temperature increases, and preserve advanced economies and stable societies.  As citizens of democracies, it is our responsibility to make informed, responsible choices.  We must choose policies that curb growth.

Graph source: PriceWaterhouseCoopers

Full-world economics and the destructive power of capital: Codfish catch data 1850 to 2000

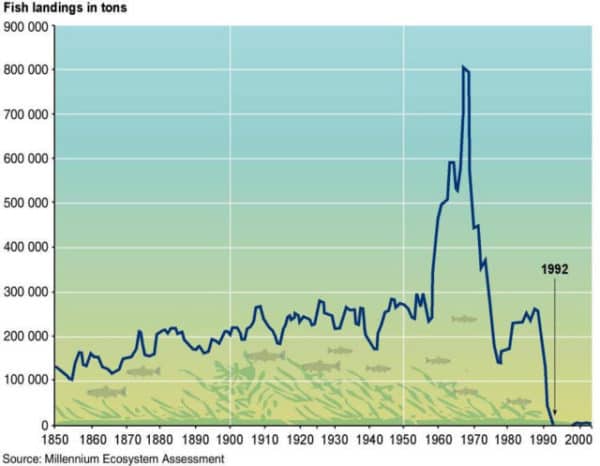
Graph of North Atlantic cod fishery, fish landing in tonnes, 1850 to 2000
Codfish catch, North Atlantic, tonnes per year

Increasingly, the ideas of economists guide the actions of our elected leaders and shape the societies and communities in which we live.  This means that incorrect or outdated economic theories can result in damaging policy errors.  So we should be concerned to learn that economics has failed to take into account a key transition: from a world relatively empty of humans and their capital equipment to one now relatively full.

A small minority of economists do understand that we have made an important shift.  In the 1990s, Herman Daly and others developed the idea that we have shifted to “full-world economies.”  (See pages 29-40 here.)  The North Atlantic cod fishery illustrates this transition.  This week’s graph shows tonnes of codfish landed per year, from 1850 to 2000.

Fifty years ago, when empty-world economics still held, the fishery was constrained by a lack of human capital: boats, motors, and nets.  At that time, adding more human capital could have caused the catch to increase.  Indeed, that is exactly what happened in the 1960s when new and bigger boats with advanced radar and sonar systems were deployed to the Grand Banks and elsewhere.  The catch tripled.  The spike in fish landings is clearly visible in the graph above.

But in the 1970s and ’80s, a shift occurred: human capital stocks—those fleets of powerful, sonar-equipped trawlers—expanded so much that the limiting factor became natural capital: the supply of fish.  The fishery began to collapse and no amount of added human capital could reverse the decline.  The system had transitioned from one constrained by human capital to one constrained by natural capital—from empty-world to full-world economics.  A similar transition is now evident almost everywhere.

An important change has occurred.  Unfortunately, economics has not internalized or adapted to this change.  Economists, governments, and business-people still act as if the shortage is in human-made capital.  Thus, we continue our drive to amass capital—we expand our factories, technologies, fuel flows, pools of finance capital, and the size of our corporations, in order to further expand the quantity and potency of human-made capital stocks.  Indeed, this is a defining feature of our economies: the endless drive to expand and accumulate supplies of capital.  That is why our system is called “capitalism.”  And a focus on human-made capital was rational when it was in short supply.  But now, in most parts of the world, human capital is too plentiful and powerful and and, thus, destructive.  It is nature and natural capital that is now scarce and limiting.  This requires an economic and civilizational shift: away from a focus on amassing human capital and toward a focus on protecting and maximizing natural capital: forests, soils, water, fish, biodiversity, wild animal populations, a stable climate, and intact ecosystems.  Failure to make that shift will push more and more of the systems upon which humans depend toward a collapse that mirrors that of the cod stock.

Graph source:  United Nations GRID-Arendal, “Collapse of Atlantic cod stocks off the East Coast of Newfoundland in 1992


Our civilizational predicament: Doubling economic activity and energy use while cutting emissions by half

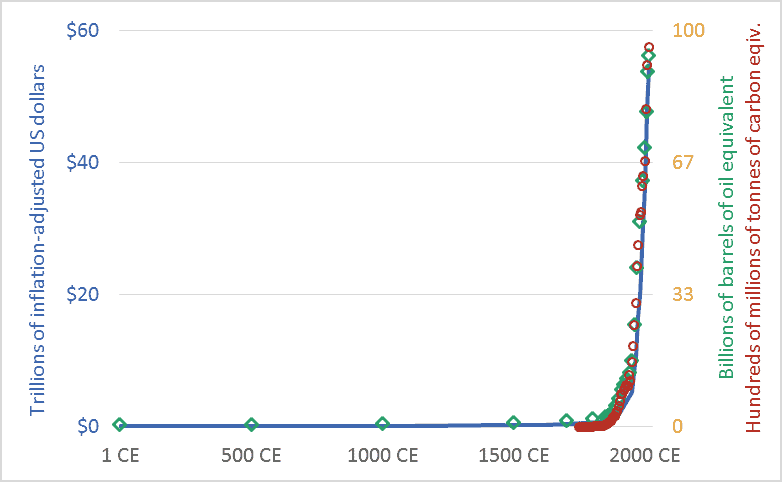
Graph of Global economic activity, energy use, and greenhouse gas emissions, 1CE to 2015CE.
Global economic activity, energy use, and carbon dioxide emissions, 1CE to 2015CE.

My friends sometimes suggest that I’m too pessimistic.  I’m not.  Rather, I’d suggest that everyone else is too optimistic.  Or, more precisely, I live in a society where people are discouraged from thinking rigorously about our predicament.  The graph above sets out our civilizational predicament, and it hints at the massive scale of the transformation that climate change requires us to accomplish in the coming decade or two.

The main point of the graph above is this: Long-term data shows that the size and speed of our global mega-civilization is precisely correlated with energy use, and energy use is precisely correlated with greenhouse gas emissions.  We have multiplied the size of our global economy and our living standards by using more energy, and this increased energy use has led us to emit more carbon dioxide and other greenhouse gases.

The graph plots three key civilizational metrics: economic activity, energy use, and carbon dioxide (CO2) emissions.  The graph covers the past 2015 years, the period from 1 CE (aka 1 AD) to 2015 CE.  The blue line depicts the size of the global economy.  The units are trillions of US dollars, adjusted for inflation.  The green diamond-shaped markers show global energy use, with all energy converted to a common measure: barrels of oil equivalent.  And the red circles show global CO2 emissions, in terms of tonnes of carbon.

Though it is seldom stated explicitly, most government and business leaders and most citizens are proceeding under the assumption that the economic growth line in the graph can continue to spike upward.  This will require the energy line to also climb skyward.  But our leaders are suggesting that the emissions line can be wrenched downward.  When people are “optimistic” about climate change, they are optimistic about doing something that has never been done before: maintaining the upward arc of the economic and energy trendlines, but somehow unhooking the emissions trendline and bending it downward, toward zero.  I worry that this will be very hard.  Most important, it will be impossibly hard unless we are realistic about what we are trying to do, and about the challenges and disruptions ahead.

We must not despair, but neither should we permit ourselves unfounded optimism.  There is a line from a great movie—the Cohen Brother’s “Miller’s Crossing”—in which the lead character, a gangster played by Gabriel Byrne, says “I’d worry a lot less if I thought you were worrying enough.”

Graph sources: GDP: Angus Maddison, The World Economy, Volume 1: A Millennial Perspective (Paris: Organization for Economic Co-operation and Development, 2001)

GHGs: Boden, T.A., Marland, G., and Andres R.J., “Global, Regional, and National Fossil-Fuel CO2 Emissions,” Carbon Dioxide Information Analysis Center (CDIAC), Oak Ridge National Laboratory, U.S. Department of Energy, Oak Ridge, Tenn., U.S.A.

Energy consumption: Vaclav Smil, Energy in Nature and Society: General Energetics of Complex Systems (Cambridge, MA: The MIT Press, 2008); British Petroleum, BP Statistical Review of World Energy: June 2016 (London: British Petroleum, 2016); pre-1500 energy levels estimated by the author based on data in Smil.

A doubling problem: 21st century exponential growth of the global economy

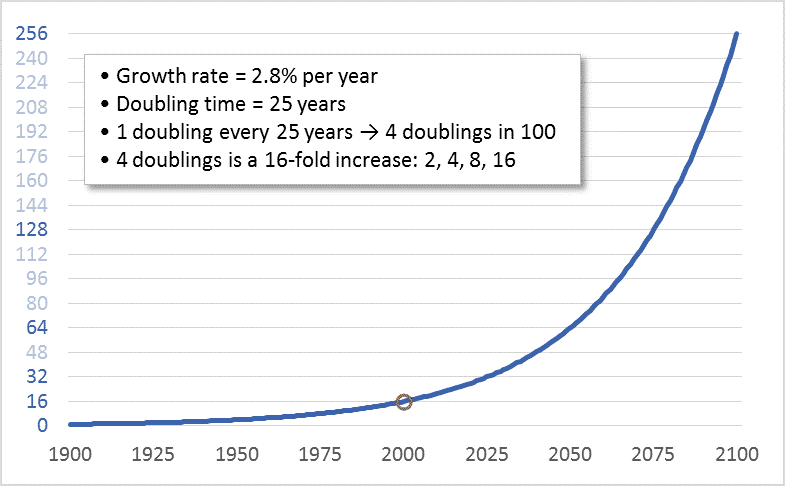
Graph of stylized exponential growth in the global economy
A notional graph modelling exponential growth in the global economy

When I was in grade-school, an uncle taught me something about limits, and about doubling.  He asked me: How many times can you fold a piece of paper in half?  Before I could reply, he told me that the answer was eight.  I thought this seemed too low.  So, as a child eager to demonstrate adults’ errors, I located a sheet of writing paper and began folding.  I managed seven folds—not even achieving the predicted eight.  I thought that the problem was the small size of the paper.  So, I located a newspaper, removed one sheet, and began folding.  I folded it eight times but could not make it to nine.

Why this limit?  Most people assume that the problem is the size of the sheet of paper: as we fold it, the paper gets smaller and, thus, the next fold becomes harder.  This is true, but the real problem is that the number of sheets to be folded increases exponentially.  Fold the paper once and it is two sheets thick.  A second fold brings the thickness to four sheets.  A third fold: eight.  A fourth, fifth, and sixth fold: sixteen sheets, thirty-two, then sixty-four.  The seventh fold doubles the thickness again to 128 sheets, and an eighth to 256.  When I was a child folding that sheet of newspaper, in attempting that ninth fold I was straining to bend 256 sheets.

Now, if I started with a very large piece  of paper perhaps I could prove my late uncle wrong and achieve that ninth fold.  It’s hard to predict precisely where limits lie.  Imagine a football-field-sized piece of paper and ten linebackers assigned the task of folding.  Those players could certainly make nine folds.  Perhaps they might even achieve ten, bending 512 sheets to increase the thickness to 1,024.  Maybe they could strain to make eleven folds, bending those 1,024 sheets to achieve a thickness of 2,048.  But eventually the doubling and redoubling would reach a point where it was impossible to double again.  Exponential growth creates a doubling problem.

Our petro-industrial-consumer mega-civilization has a doubling problem.  During the 20th century we doubled the size of the global economy four times.  Four doublings is a sixteenfold increase: 2, 4, 8, 16.  Despite this multiplication, today, every banker, CEO, investor, Minister of Finance, shareholder, bondholder, and would-be retiree (i.e., nearly all of us) wants to keep economic growth going.  And we want growth to continue at “normal” rates—rates that lead to a doubling in the size of the economy about every 25 years.  Thus, in effect, what we want in the 21st century is another four doublings—another sixteenfold increase.  The graph above shows the sixteenfold increase that occurred during the 20th century and shows what a sixteenfold increase during the 21st century would look like.

The first doubling of the 21st century is already underway.  We’re rapidly moving toward a global economy in 2025 that is twice the size of the one that existed in 2000.  But the economy in 2000 was already placing a heavy boot upon the biosphere.  By that year, North America’s East Coast cod fishery had already collapsed, greenhouse gas emissions were already driving up temperatures, and the Amazon was shrinking.  Despite this, we seem to believe that a 2025 economy twice as large as that year-2000 economy is “sustainable.”  Even worse, in 2025, we won’t be “sustaining” that two-times-2000 economy, we’ll be working to double it again.

Clearly, at some point, this has to stop.  Even those who think that the Earth can support and withstand a human economy twice the size that existed in 2000 must begin to have doubts about an economy four or eight times as large.  There can be no dispute that economic growth must end.  Though we may disagree as to when.

Perceptive readers will have noted a shortcoming in my paper-folding analogy: That system runs into hard limits; at some point, attempts to double the number of sheets simply fail, and that failure is immediately apparent.  Our civilizational-biospheric system is different.  Limits to Earth’s capacities to provision the human economy and absorb its wastes certainly exist, but they are not hard limits.  Given the immense power of our economy and technologies, we can breach Earth’s limits, at least for a time.  On many fronts we already have.  It will only be in hindsight—as ecosystems collapse and species disappear and the biosphere and climate become destabilized, damaged, and hostile—that we will know for sure that we’ve crossed a terrible line.  Only then will we know for sure that at some point in our past our doubling proceeded too far.  So, unlike paper folding, determining the limits of economic growth requires human wisdom and self-restraint.