Surrounded by Solutions: electric buses, solar panels, high-speed trains, and more

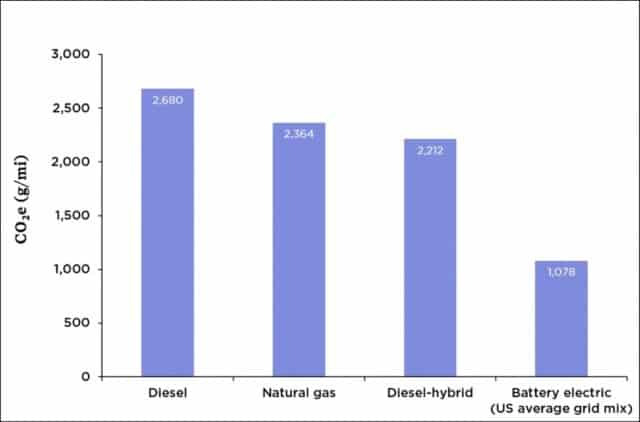
Graph of lifecycle GHG emissions for buses using various energy sources
Lifecycle greenhouse gas emissions for buses using various energy sources

Most North Americans have never seen an electric bus.  Admittedly, momentum is building—some jurisdictions, notably California, have committed to buying only electric transit buses after 2029.  But such buses remain rare in Canada and the United States.  A 2018 report found that just 0.2% of US buses (two in a thousand) were electric, and that tiny percentage is rising very slowly.  New York City provides an example of the modest pace of e-bus adoption—a three-year pilot project, adding just 10 electric buses to its fleet of 5,700.

How’s this for a contrast?  Shenzhen China has 16,000 electric buses—100% of its fleet.  And that city is not unusual in China.  Overall, that country has more than 400,000 electric buses, and is adding 100,000 more each year, with numbers projected to reach one million by 2023.

The graph above shows that electric buses can cut greenhouse gas (GHG) emissions by 60 percent (1,078 grams COequivalent per mile for electric vs. 2,680 grams for diesel).  These low emission values for e-buses take into account that much of North American electricity is generated by burning coal or natural gas.  If we assume a future in which most of our electricity can come from cleaner solar and wind sources then e-buses can reduce emissions by 85 percent compared to diesel.

In addition to having most of the planet’s low-emission buses, China is also leading the world in electric car production and sales.  In 2017, China produced more than half the world’s output of electric cars.  Chinese motorists purchased 580,000 EVs in 2017 while Americans purchased about 200,000 and Canadians 15,000.  Admittedly, many of those Chinese autos are small (think Smart Cars, not Teslas), but that is rapidly changing as Chinese cars become larger and more luxurious.  Indeed, their more modest size can be seen as part of the solution, as the production of small EVs creates lower emissions than the production of large ones.

China is also leading the world in high-speed rail—passenger trains that travel 250 to 350 km/h.  China has added 30,000 kms of new high-speed rail track since 2003 and plans to add another 10,000 kms by 2025, for a total of 40,000 kms—enough to circle the planet.  (For more information on the tremendous potential of high-speed rail, see this blog post, and this one.)

Finally, and this is well known, China dominates the world in solar-panel production and solar-power generation, with production and installation rates several times those in the Americas or EU.  Moreover, China is not the only country shaming us in terms of clean energy adoption: India installed more solar power capacity than the US in 2017 and again in 2018, and far more than Canada.

The four examples above illustrate something important about the current climate crisis: solutions are thick on the ground, but we in North America are simply choosing not to adopt them.  China has made itself the world’s largest solar panel manufacturer; the US has doubled-down on coal, and Canada continues to pin its economic fortunes on the carbon-fuel sector.  China is the world’s largest EV producer; in Canada and the US the best-selling vehicle is the Ford F-150.  China has built tens-of-thousands of kms of passenger-rail track; North Americans have doubled air travel.  We’re walking past mature and promising technologies—choosing to ignore them.

Granted, China has a larger population, but we in North America are far richer.  The combined size of the Canadian and US economies is double that of China’s economy.  Canadian per-capita GDP is five times higher than that of China, and US per-capita GDP is seven times higher.  For every dollar the average Chinese person has to spend on an electric car or solar panels, Canadians and Americans have five to seven dollars.

Moreover, we’re not dependent on foreign technologies or companies.  Canadian Solar, headquartered in Guelph, is one of the six largest solar panel companies in the world.  Bombardier, headquartered in Montreal, is one of the three largest producers of high-speed rail equipment in the world—supplying China with locomotives and rolling stock.  And New Flyer Bus Company, headquartered in Winnipeg, has delivered electric buses to several US and Canadian cities.

We’re not short of high-tech corporations—many world-leading technology companies are headquartered in Canada and the US.  We’re not without technological options.  And we’re not short of funds.  We have extremely promising options and opportunities.  We’re not doomed.  But we are reckless, indulgent, short-sighted, and despicably immoral.  And by continuing to act in the ways we are we will probably manage to doom ourselves.  But that need not be the case.  Solutions abound.

Let’s not dwell on the negative.  Instead, let’s acknowledge the tremendous upside potential and technological possibilities.  Solar panels and electric trains, buses, and cars are solutions close at hand.  Within a decade, North America could host tens-of-thousands of kms of new passenger rail track, hundreds-of-thousands of electric buses, tens-of-millions of electric vehicles, and billions of new solar panels.  This wouldn’t be a complete solution to the climate crisis, but it would be a very good start.

Graph source: Jimmy O’Dea and the Union of Concerned Scientists

Methane and climate: 10 things you should know

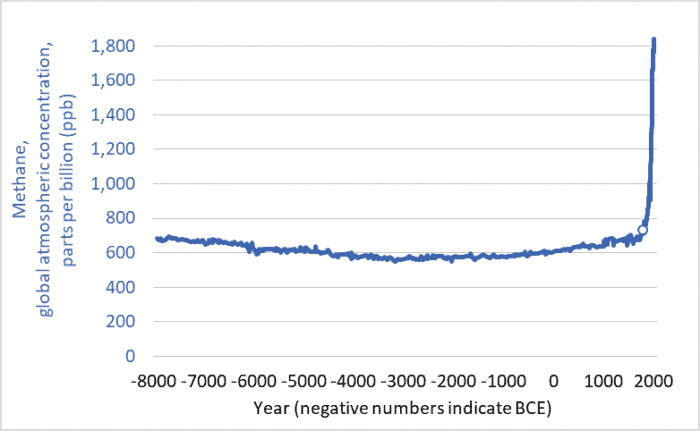
Graph of global atmospheric methane concentrations
Global atmospheric methane concentrations, past 10,000+ years (8000 BCE to 2018 CE)

The graph above shows methane concentrations in Earth’s atmosphere over the past 10,000+ years: 8000 BCE to 2018 CE.  The units are parts per billion (ppb).  The year 1800 is marked with a circle.

Note the ominous spike.  As a result of increasing human-caused emissions, atmospheric methane levels today are two-and-a-half times higher than in 1800.  After thousands of years of relatively stable concentrations, we have driven the trendline to near-vertical.

Here are 10 things you should know about methane and the climate:

1. Methane (CH4) is one of the three main greenhouse gases, along with carbon dioxide (CO2) and nitrous oxide (N2O).

2. Methane is responsible for roughly 20% of warming, while carbon dioxide is responsible for roughly 70%, and nitrous oxide the remaining 10%.

3. Methane is a powerful greenhouse gas (GHG).  Pound for pound, it is 28 times more effective at trapping heat than is carbon dioxide (when compared over a 100-year time horizon, and 84 times as effective at trapping heat when compared over 20 years).  Though humans emit more carbon dioxide than methane, each tonne of the latter traps more heat.

4. Fossil-fuel production is the largest single source.  Natural gas is largely made up of methane (about 90%).  When energy companies drill wells, “frac” wells, and pump natural gas through vast distribution networks some of that methane escapes.  (In the US alone, there are 500,000 natural gas wells, more than 3 million kilometers of pipes, and millions of valves, fittings, and compressors; see reports here and here.)  Oil and coal production also release methane—often vented into the atmosphere from coal mines and oil wells.  Fossil-fuel production is responsible for about 19% of total (human-caused and natural) methane emissions.  (An excellent article by Saunois et al. is the source for this percentage and many other facts in this blog post.)  In Canada, policies to reduce energy-sector methane emissions by 40 percent will be phased in over the next seven years, but implementation of those policies has been repeatedly delayed.

5. Too much leakage makes electricity produced using natural gas as climate-damaging as electricity from coal.  One report found that for natural gas to have lower overall emissions than coal the leakage rate would have to be below 3.2%.  A recent study estimates leakage in the US at 2.3%.  Rates in Russia, which supplies much of the gas for the EU, are even higher.  Until we reduce leakage rates, the advantage of shutting down coal-fired power plants and replacing them with natural gas generation will remain much more modest than often claimed.

6. Domestic livestock are the next largest source of methane.  Cattle, sheep,  and other livestock that graze on grass emit methane from their stomachs through their mouths.  This methane is produced by the symbiotic bacteria that live in the guts of these “ruminants” and enable them to digest grass and hay.  In addition, manure stored in liquid form also emits methane.  Livestock and manure are responsible for roughly 18% of total methane emissions.

7. Rice paddy agriculture, decomposing organic matter in landfills, and biomass burning also contribute to methane emissions.  Overall, human-caused emissions make up about 60% of the total.  And natural sources (wetlands, swamps, wild ruminants, etc.) contribute the remaining 40%.

8. There is lots of uncertainty about emissions.  Fossil fuel production and livestock may be responsible for larger quantities than is generally acknowledged.  The rise in atmospheric concentrations is precisely documented, but the relative balance between sources and sinks and the relative contribution of each source is not precisely known.

9. There is a lot of potential methane out there, and we risk releasing it.  Most of the increase in emissions in recent centuries has come from human systems (fossil fuel, livestock, and rice production; and landfills).  Emissions from natural systems (swamps and wetlands, etc.) have not increased by nearly as much.  But that can change.  If human actions continue to cause the planet to warm, natural methane emissions will rise as permafrost thaws.  (Permafrost contains huge quantities of organic material, and when that material thaws and decomposes in wet conditions micro-organisms can turn it into methane.)  Any such release of methane will cause more warming which can thaw more permafrost and release more methane which will cause more warming—a positive feedback.

Moreover, oceans, or more specifically their continental shelves, contain vast quantities of methane in the form of “methane hydrates” or “clathrates”—ice structures that hold methane stable so long as the temperature remains cold enough.  But heat up the coastal oceans and some of that methane could begin to bubble up to the surface.  And there are huge amounts of methane contained in those hydrates—the equivalent of more than 1,000 years of human-caused emissions.  We risk setting off the “methane bomb“—a runaway warming scenario that could raise global temperatures many degrees and catastrophically damage the biosphere and human civilization.

Admittedly, the methane bomb scenario is unlikely to come to pass.  While some scientists are extremely concerned, a larger number downplay or dismiss it.  Nonetheless a runaway positive feedback involving methane represents a low-probability but massive-impact risk; our day-to-day actions are creating a small risk of destroying all of civilization and most life on Earth.

10. We can easily reduce atmospheric methane concentrations and  attendant warming; this is the good news.  Methane is not like CO2, which stays in the atmosphere for centuries.  No, methane is a “short-lived” gas.  On average, it stays in the atmosphere for less than ten years.  Many natural processes work to strip it out of the air.  Currently, human and natural sources emit about 558 million tonnes of methane per year, and natural processes in the atmosphere and soils remove all but 10 million tonnes.  (again, see Saunois et al.)  Despite our huge increase in methane production, sources and sinks are not that far out of balance.  Therefore, if we stop increasing our emissions then atmospheric concentrations could begin to fall.  We might see significant declines in just decades.  This isn’t the case for CO2, which will stay in the atmosphere for centuries.  But with methane, we have a real chance of reducing atmospheric levels and, as we do so, moderating warming and slowing climate change.

A series of policies focused on minimizing emissions from the fossil-fuel sector (banning venting and minimizing leaks from drilling and fracking and from pipes) could bring the rate of methane creation below the rate of removal and cause atmospheric levels to fall.  A more rational approach to meat production (including curbing over-consumption in North America and elsewhere) could further reduce emissions.  This is very promising news.  Methane reduction represents a “low-hanging fruit” when it comes to moderating climate change.

The methane problem is the climate problem in microcosm.  There are some relatively simple, affordable steps we can take now that will make a positive difference.  But, if we don’t act fast, aggressively, and effectively, we risk unleashing a whole range of effects that will swiftly move our climate into chaos and deprive humans of the possibility of limiting warming to manageable levels.  We can act to create some good news today, or we can suffer a world of bad news tomorrow.

Graph sources:
– United States Environmental Protection Agency (US EPA), “Climate Change Indicators: Atmospheric Concentrations of Greenhouse Gases.
– Commonwealth Scientific and Industrial Research Organisation (CSIRO), “Latest Cape Grim Greenhouse Gas Data.
– National Oceanic and Atmospheric Administration (NOAA), Earth System Research Laboratory, Global Monitoring Division, “Trends in Atmospheric Methane.

Home grown: 67 years of US and Canadian house size data

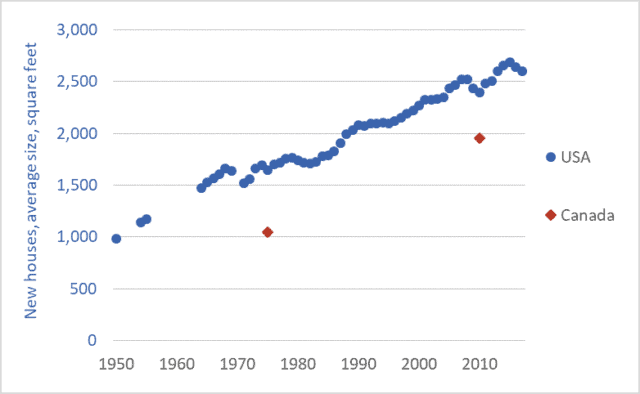
Graph of the average size of new single-family homes, Canada and the US, 1950-2017
Average size of new single-family homes, Canada and the US, 1950-2017

I was an impressionable young boy back in 1971 when my parents were considering building a new home.  I remember discussions about house size.  1,200 square feet was normal back then.  1,600 square feet, the size of the house they eventually built, was considered extravagant—especially in rural Saskatchewan.  And only doctors and lawyers built houses as large as 2,000 square feet.

So much has changed.

New homes in Canada and the US are big and getting bigger.  The average size of a newly constructed single-family detached home is now 2,600 square feet in the US and probably 2,200 in Canada.  The average size of a new house in the US has doubled since 1960.  Though data is sparse for Canada, it appears that the average size of a new house has doubled since the 1970s.

We like our personal space.  A lot.  Indeed, space per person has been growing even faster than house size.  Because as our houses have been growing, our families have been shrinking, and this means that per-capita space has increased dramatically.  The graph below, from shrinkthatfootprint.com, shows that, along with Australia, Canadians and Americans enjoy the greatest per-capita floorspace in the world.  The average Canadian or American each has double the residential space of the average UK, Spanish, or Italian resident.

Those of us fortunate enough to have houses are living in the biggest houses in the world and the biggest in history.  And our houses continue to get bigger.  This is bad for the environment, and our finances.

Big houses require more energy and materials to construct.  Big houses hold more furniture and stuff—they are integral parts of high-consumption lifestyles.  Big houses contribute to lower population densities and, thus, more sprawl and driving.  And, all things being equal, big houses require more energy to heat and cool.  In Canada and the US we are compounding our errors: making our houses bigger, and making them energy-inefficient.  A 2,600 square foot home with leading edge ‘passiv haus’ construction and net-zero energy requirements is one thing, but a house that size that runs its furnace half the year and its air conditioner the other half is something else.  And multiply that kind of house times millions and we create a ‘built in’ greenhouse gas emissions problem.

Then there are the issues of cost and debt.  We continually hear that houses are unaffordable.  Not surprising if we’re making them twice as large.  What if, over the past decade, we would have made our new houses half as big, but made twice as many?  Might that have reduced prices?

And how are large houses connected to large debt-loads?  Canadian debt now stands at a record $1.8 trillion.  Much of that is mortgage debt.  Even at low interest rates of 3.5 percent, the interest on that debt is $7,000 per year for a hypothetical family of four.  And that’s just the average.  Many families are paying a multiple of that amount, just in interest.  Then on top of that there are principle payments.  It’s not hard to see why so many families struggle to save for retirement or pay off debt.

Our ever-larger houses are filling the air with emissions; emptying our pockets of saving; filling up with consumer-economy clutter; and creating car-mandatory unwalkable, unbikable, unlovely neighborhoods.

The solutions are several fold.  First, new houses must stop getting bigger.  And they must start getting smaller.  There is no reason that Canadian and US residential spaces must be twice as large, per person, as European homes.  Second, building standards must get a lot better, fast.  Greenhouse gas emissions must fall by 50 to 80 percent by mid-century.  It is critical that the houses we build in 2020 are designed with energy efficient walls, solar-heat harvesting glass, and engineered summer shading such that they require 50 to 80 percent less energy to heat and cool.  Third, we need to take advantage of smaller, more rational houses to build more compact, walkable, bikable, enjoyable neighborhoods.  Preventing sprawl starts at home.

Finally, we need to consider questions of equity, justice, and compassion.  What is our ethical position if we are, on the one hand, doubling the size of our houses and tripling our per-capita living space and, on the other hand, claiming that we “can’t afford” housing for the homeless.  Income inequality is not just a matter of abstract dollars.  This inequality is manifest when some of us have rooms in our homes we seldom visit while others sleep outside in the cold.

We often hear about the “triple bottom line”: making our societies ecologically, economically, and socially sustainable.  Building oversized homes moves us away from sustainability, on all three fronts.

Graph sources:
US Department of Commerce/US Census Bureau, “2016 Characteristics of New Housing”
US Department of Commerce/US Census Bureau, “Characteristics of New Housing: Construction Reports”
US Department of Commerce/US Census Bureau, “Construction Reports: Characteristics of New One-Family Homes: 1969”
US Department of Labour, Bureau of Labour Statistics, “New Housing and its Materials:1940-56”
Preet Bannerjee, “Our Love Affair with Home Ownership Might Be Doomed,” Globe and Mail, January 18, 2012 (updated February 20, 2018) 

Rail lines, not pipelines: the past, present, and future of Canadian passenger rail

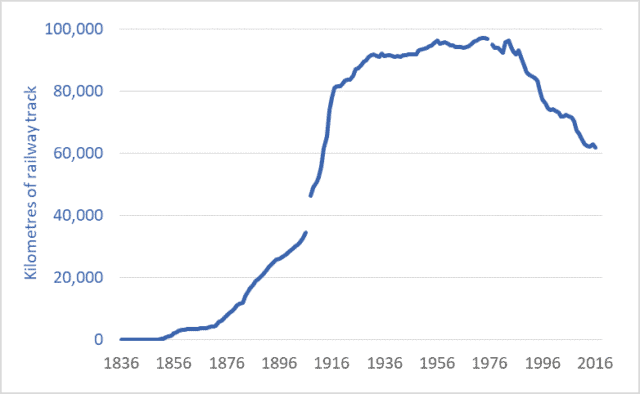
Graph of Canadian railway network, kilometres, historic, 1836 to 2016
Canadian railway network, kilometres of track, 1836 to 2016

One kilometre of oil pipeline contains the same amount of steel as two kilometres of railway track.*  The proposed Trans Mountain pipeline expansion will, if it goes ahead, consume enough steel to build nearly 2,000 kms of new passenger rail track.  The Keystone XL project would consume enough steel to build nearly 4,000 kms of track.  And the now-cancelled Energy East pipeline would have required as much steel as 10,000 kms of track.  (For an overview of proposed pipelines, see this CAPP publication.)

With these facts in mind, Canadians (and Americans) should consider our options and priorities.  There’s tremendous pressure to build new pipelines.  Building them, proponents claim, will result in jobs and economic development.  But if we’re going to spend billions of dollars, lay down millions of tonnes of steel, and consume millions of person-hours of labour, should we be building soon-to-be-obsolete infrastructure to transport climate-destabilizing fossil fuels?  Or should we take the opportunity to create even more jobs building a zero-emission twenty-first century transportation network for Canada and North America?  Admittedly, the economics of passenger rail are different than those of pipelines; building a passenger rail system is not simply a matter of laying down steel rails.  But for reasons detailed below, limiting global warming probably makes significant investments in passenger rail inevitable.

The graph above shows the total length of the Canadian railway network.  The time-frame is the past 180 years: 1836 to 2016.  Between 1880 and 1918, Canada built nearly 70,000 kms of railway track—nearly 2,000 kms per year, using tools and machinery that were crude by modern standards, and at a time when the nation and its citizens were poor, compared to today.  In the middle and latter decades of the twentieth century, tens of thousands of kms of track were upgraded to accommodate heavier loads.

The length of track in the Canadian railway system peaked in the 1980s.  Recent decades have seen the network contract.  About a third of Canadian rail lines have been torn up and melted down over the past three-and-a-half decades.  Passenger rail utilization in recent years has fallen to levels not seen since the 1800s—down almost 90 percent from its 1940s peak, despite a doubling of the Canadian population.  Indeed, ridership on Via Rail is half of what it was as recently as 1989.

Contrast China.  In just one decade, that nation has built 25,000 miles of high-speed passenger rail lines.  Trains routinely operate at speeds in excess of 300 km/h.  Many of those trains were designed and built by Canada’s Bombardier.  China plans to build an additional 13,000 kms of high-speed passenger lines in the next seven years.

Japan’s “bullet trains” began running more than 50 years ago.  The Japanese high-speed rail network now exceeds 2,700 kms, with trains reaching speeds of 320 km/h.

Saudi Arabia, Poland, Turkey, and Morocco all have high-speed lines, as do more than a dozen nations in Europe.  Uzbekistan—with a GDP one-twentieth that of Canada’s—has built 600 kms of high-speed rail line and has trains operating at 250 km/h.

The construction of Canadian and North American passenger rail networks is probably inevitable.  As part of an international effort to hold global temperature increases below 2 degrees C, Canada has committed to reduce greenhouse gas (GHG) emissions emission by 30 percent by 2030—now less than 12 years away.  Emissions reductions must continue after 2030, reaching 50 to 60 percent in little more than a generation.  Emission reductions of this magnitude require an end to routine air travel.  Aircraft may still be needed for trans-oceanic travel, but within continents long-distance travel will have to take place using zero-emission vehicles: electric cars or buses for shorter journeys, and electrified passenger trains for longer ones.

This isn’t bad news.  Trains can transport passengers from city-centre to city-centre, eliminating long drives to and from airports.  Trains do not require time-consuming airport security screenings.  These factors, combined with high speeds, mean that for many trips, the total travel time is less for trains than for planes.  And because trains have more leg-room and often include observation cars, restaurants, and lounges, they are much more comfortable, enjoyable, and social.  For some long journeys where it is not cost-effective to build high-speed rail lines, European-style sleeper trains can provide comfortable, convenient overnight transport.  In other cases, medium-speed trains (traveling 150 to 200 km/h) may be the most cost-effective option.

Canada must embrace the inevitable: air travel must be cut by 90 percent; and fast, comfortable, zero-emission trains must take the place of the planes.  Maybe we can build thousands of kms of passenger rail lines and thousands of kms of pipelines.  But given the gravity and menace of the climate crisis and given the rapidly approaching deadlines to meet our emission-reduction commitments, it isn’t hard to see which should be our priority.


*For example, Kinder Morgan’s Trans Mountain pipeline would be made up primarily of 36” pipe (914mm) with a 0.465 wall thickness (11.8 mm).  This pipe weighs 262 kgs/m.  Rails for high-speed trains and other demanding applications often weigh 60 kgs/m.  As two rails are needed, this means 120 kgs/m—half the weight of a comparable length of pipeline.

Graph sources:
Urquhart and Buckley, 1965, Historical Statistics of Canada.
Leacy, Urquhart, and Buckley, 1983, Historical Statistics of Canada, 2nd Ed.
Stats. Can., Various years, Railway Transport in Canada: General Statistics.
Stats. Can., CANSIM Table 404-0010


Will Trump’s America crash Earth’s climate?

Graph of US energy consumption by fuel, 1990 to 2050
US energy consumption by fuel, 1990 to 2050

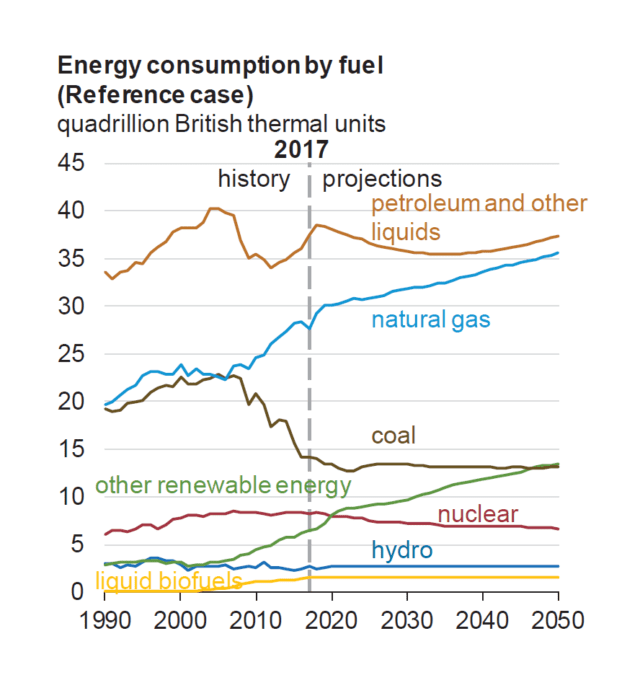
Last week, the US Department of Energy (DOE) released its annual report projecting future US energy production and consumption and greenhouse gas (GHG) emissions.  This year’s report, entitled Annual Energy Outlook 2018, with Projections to 2050 forecasts a nightmare scenario of increasing fossil fuel use, increasing emissions, lackluster adoption of renewable energy options, and a failure to shift to electric vehicles, even by mid-century.

The graph above is copied from that DOE report.  The graph shows past and projected US energy consumption by fuel type.  The top line shows “petroleum and other liquids.”  This is predominantly crude oil products, with a minor contribution from “natural gas liquids.”  For our purposes, we can think of it as representing liquid fuels used in cars, trucks, planes, trains, and ships.  Note how the US DOE is projecting that in 2050 America’s consumption of these high-emission fuels will be approximately equal to levels today.

The next line down is natural gas.  This is used mostly for heating and for electricity generation.  Note how the DOE is projecting that consumption (i.e., combustion) of natural gas will be about one-third higher in 2050 than today.

Perhaps worst of all, coal combustion will be almost as high in 2050 as it is today.   No surprise, the DOE report (page 15) projects that US GHG emissions will be higher in 2050 than today.

Consumption of renewable energy will rise.  The DOE is projecting that in 2050 “other renewables”—essentially electricity from solar photovoltaic panels and wind turbines—will provide twice as much power as today.  But that will be only a fraction of the energy supplied by fossil fuels: oil, natural gas, and coal.

How can this be?  The world’s nations have committed, in Paris and elsewhere, to slash emissions by mid-century.  To keep global temperature increases below 2 degrees Celsius, industrial nations will have to cut emissions by half by 2050.  So what’s going on in America?

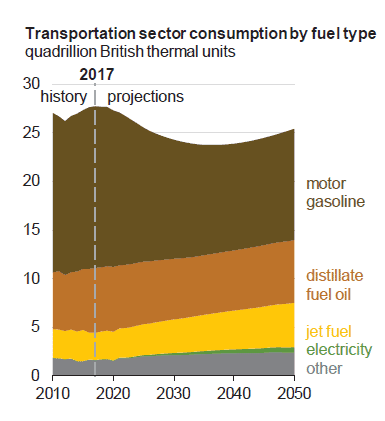
The DOE projections reveal that America’s most senior energy analysts and policymakers believe that US policies currently in place will fail to curb fossil fuel use and reduce GHG emissions.  The DOE report predicts, for example, that in 2050 electric vehicles will make up just a small fraction of the US auto fleet.  See the graph below.  Look closely and you’ll see the small green wedge representing electrical energy use in the transportation sector.  The graph also shows that the the consumption of fossil fuels—motor gasoline, diesel fuel, fuel oil, and jet fuel—will be nearly as high in 2050 as it is now.  This is important: The latest data from the top experts in the US government predict that, given current policies, the transition to electric vehicles will not happen.

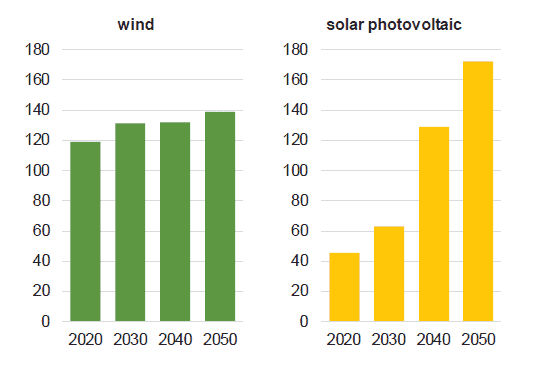
The next graph, below, shows that electricity production from solar arrays will increase significantly.  But the projection is that the US will not install significant numbers of wind turbines, so long as current policies remain in force and current market conditions prevail.

The report projects (page 84) that in 2050 electricity generation from the combustion of coal and natural gas will be twice as high as generation from wind turbines and solar panels.

Clearly, this is all just a set of projections.  The citizens and governments of the United States can change this future.  And they probably will.  They can implement policies that dramatically accelerate the transition to electric cars, electric trains, energy-efficient buildings, and low-emission renewable energy.

But the point of this DOE report (and the point of this blog post) is that such policies are not yet in place.  In effect, the US DOE report should serve as a warning: continue as now and the US misses its emissions reduction commitments by miles, the Earth probably warms by 3 degrees or more, and we risk setting off a number of global climate feedbacks that could render huge swaths of the planet uninhabitable and kill hundreds of millions of people this century.

The house is on fire.  We can put it out.  But the US Department of Energy is telling us that, as of now, there are no effective plans to do so.

Perhaps step one is to remove the arsonist-in-chief.


Earth’s dominant bird: a look at 100 years of chicken production

Graph of Chicken production, 1950-2050
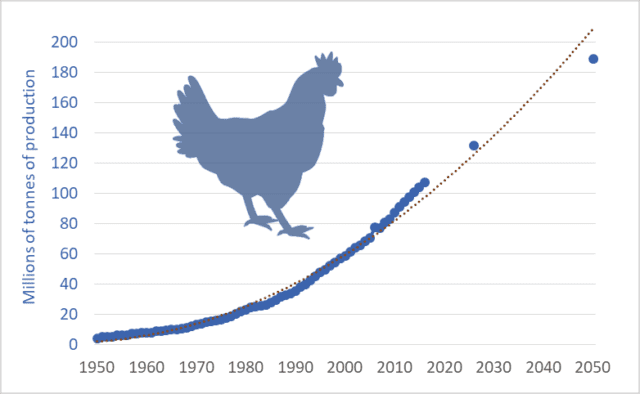
Chicken meat production, global, actual and projected, 1950 to 2050

There are approximately 23 billion chickens on the planet right now.   But because the life of a meat chicken is short—less than 50 days—annual production far exceeds the number of chickens alive at any one time.  In 2016, worldwide, chicken production topped 66 billion birds.  Humans are slaughtering, processing, and consuming about 2,100 chickens per second.

We’re producing a lot of chicken meat: about 110 million tonnes per year.  And we’re producing more and more.  In 1966, global production was 10 million tonnes.  In just twelve years, by 1978, we’d managed to double production.  Fourteen years after that, 1992, we managed to double it again, to 40 million tonnes.  We doubled it again to 80 million tonnes by 2008.  And we’re on track for another doubling—a projected 160 million tonnes per year before 2040.  By mid-century, production should exceed 200 million tonnes—20 times the levels in the mid-’60s.  This week’s graph shows the steady increase in production.  Data sources are listed below.

The capacity of our petro-industrial civilization to double and redouble output is astonishing.  And there appears to be no acknowledged limit.  Most would predict that as population and income levels rise in the second half of the century—as another one or two billion people join the “global middle class”—that consumption of chicken and other meats will double again between 2050 and 2100.  Before this century ends, consumption of meat (chicken, pork, beef, lamb, farmed fish, and other meats) may approach a trillion kilograms per year.

Currently in Canada the average chicken farm produces about 325,000 birds annually.  Because these are averages, we can assume that the output of the largest operations is several times this figure.  In the US, chicken production is dominated by contracting.  Large transnationals such as Tyson Foods contract with individual growers to feed birds.  It is not unusual for a contract grower to have 6 to 12 barns on his or her farm and raise more than a million broiler chickens per year.

We’re probably making too many McNuggets.  We’re probably catching too many fish.  We’re probably feeding too many pigs.  And it is probably not a good idea to double the number of domesticated livestock on the planet—double it to 60 billion animals.  It’s probably time to rethink our food system.  

Graph sources:
FAOSTAT database
OECD-FAO, Agricultural Outlook 2017-2026
Brian Revell: One Man’s Meat … 2050?
Lester Brown: Full Planet, Empty Plates
FAO: World Agriculture Towards 2030/2050, the 2012 revision

The 100th Anniversary of high-input agriculture

Graph of tractor and horse numbers, Canada, historic, 1910 to 1980
Tractors and horses on farms in Canada, 1910 to 1980

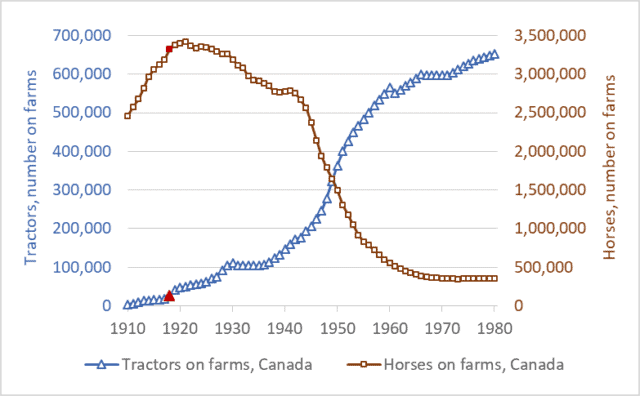
2018 marks the 100th anniversary of the beginning of input-dependent farming—the birth of what would become modern high-input agriculture.  It was in 1918 that farmers in Canada and the US began to purchase large numbers of farm tractors.  These tractors required petroleum fuels.  Those fuels became the first major farm inputs.  In the early decades of the 20th century, farmers became increasingly dependent on fossil fuels, in the middle decades most also became dependent on fertilizers, and in the latter decades they also became dependent on agricultural chemicals and high-tech, patented seeds.

This week’s graph shows tractor and horse numbers in Canada from 1910 to 1980.  On both lines, the year 1918 is highlighted in red.  Before 1918, there were few tractors in Canada.  The tractors that did exist—mostly large steam engines—were too big and expensive for most farms.  But in 1918 three developments spurred tractor proliferation: the introduction of smaller, gasoline-engine tractors (The Fordson, for example); a wartime farm-labour shortage; and a large increase in industrial production capacity.  In the final year of WWI and in the years after, tractor sales took off.  Shortly after, the number of horses on farms plateaued and began to fall.  Economists Olmstead and Rhode have produced a similar graph for the US.

It’s important to understand the long-term significance of what has unfolded since 1918.  Humans have practiced agriculture for about 10,000 years—about 100 centuries.  For 99 centuries, there were almost no farm inputs—no industrial products that farmers had to buy each spring in order to grow their crops.  Sure, before 1918, farmers bought farm implements—hoes, rakes, and sickles in the distant past, and plows and binders more recently.  And there were some fertilizer products available, such as those derived from seabird guano (manure) in the eighteenth and nineteenth centuries.  And farmers occasionally bought and sold seeds.  But for most farmers in most years before about 1918, the production of a crop did not require purchasing an array of farm inputs.  Farm chemicals did not exist, very little fertilizer was available anywhere in the world until after WWII, and farmers had little use for gasoline or diesel fuel.  Before 1918, farms were largely self-sufficient, deriving seeds from the previous years’ crop, fertility from manure and nitrogen-fixing crops, and pulling-power from horses energized by the hay and grain that grew on the farm itself.  For 99 of the 100 centuries that agriculture has existed, farms produced the animal- and crop-production inputs they needed.  Nearly everything that went into farming came out of farming.

For 99 percent of the time that agriculture has existed there were few farm inputs, no farm-input industries, and little talk of “high input costs.”  Agricultural production was low-input, low-cost, solar-powered, and low-emission.  In the most recent 100 years, however, we’ve created a new kind of agricultural system: one that is high-input, high-cost, fossil-fuelled, and high-emission.

Modern agriculture is also, admittedly, high-output.  But this last fact must be understood in context: the incredible food-output tonnage of modern agriculture is largely a reflection of the megatonnes of fertilizers, fuels, and chemicals we push into the system.  Nitrogen fertilizer illustrates this process.  To produce, transport, and apply one tonne of synthetic nitrogen fertilizer requires an amount of energy equal to almost two tonnes of gasoline.  Modern agriculture is increasingly a system for turning fossil fuel Calories into food Calories.  Food is increasingly a petroleum product.

The high-input era has not been kind to farmers.  Two-thirds of Canadian farmers have been ushered out of agriculture over the past two generations.  More troubling and more recent: the number of young farmers—those under 35—has been reduced by two-thirds since 1991.  Farm debt is at a record high: nearly $100 billion.  And about the same amount, $100 billion, has had to be transferred from taxpayers to farmers since the mid-1980s to keep the Canadian farm sector afloat.  Farmers are struggling with high costs and low margins.

This is not a simplistic indictment of “industrial agriculture.”  We’re not going back to horses.  But on the 100th anniversary of the creation of fossil-fuelled, high-input agriculture we need to think clearly and deeply about our food production future.  As our fossil-fuel supplies dwindle, as greenhouse gas levels rise, as we struggle to feed and employ billions more people, and as we struggle with many other environmental and economic problems, we will need to rethink and radically transform our food production systems.  Our current food system isn’t “normal”: it’s an anomaly—a break with the way that agriculture has operated for 99 percent of its history.  It’s time to ask hard questions and make big changes.  It’s time to question the input-maximizing production systems agribusiness corporations have created, and to explore new methods of low-input, low-energy-use, low-emission production.

Rather than maximizing input use, we need to maximize net farm incomes, maximize the number of farm families on the land, and maximize the resilience and sustainability of our food systems.

Everything must double: Economic growth to mid-century

Graph of GDP of the world's largest economies, 2016 vs 2050
Size of the world’s 17 largest economies, 2016, and projections for 2050

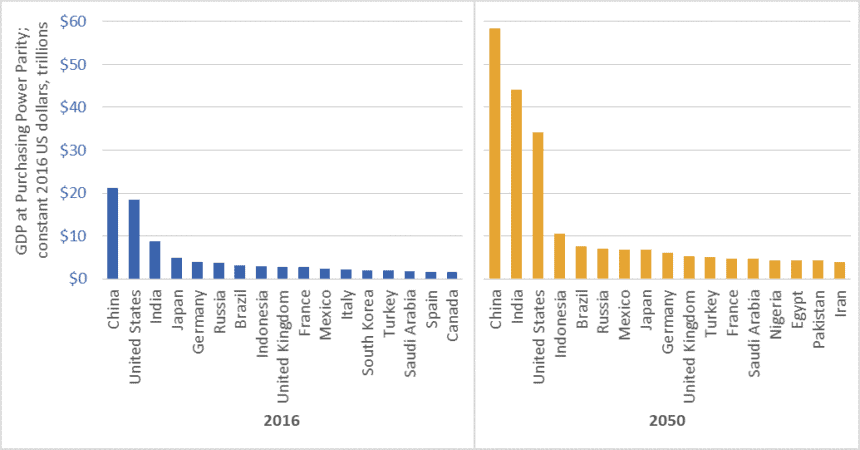
In February 2017, global accounting firm PricewaterhouseCoopers (PwC) released a report on economic growth entitled The Long View: How will the Global Economic Order Change by 2050?  The graph above is based on data from that report.  (link here)  It shows the gross domestic product (GDP) of the largest economies in the world in 2016, and projections for 2050.  The values in the graph are stated in constant (i.e., inflation adjusted) 2016 dollars.

PwC projects that China’s economy in 2050 will be larger than the combined size of the five largest economies today—a list that includes China itself, but also the US, India, Japan, and Germany.

Moreover, the expanded 2050 economies of China and India together ($102.5 trillion in GDP) will be almost as large as today’s global economy ($107 trillion).

We must not, however, simply focus on economic growth “over there.”  The US economy will nearly double in size by 2050, and Americans will continue to enjoy per-capita GDP and consumption levels that are among the highest in the world.  The size of the Canadian economy is similarly projected to nearly double.   The same is true for several EU countries, Australia, and many other “rich” nations.

Everything must double

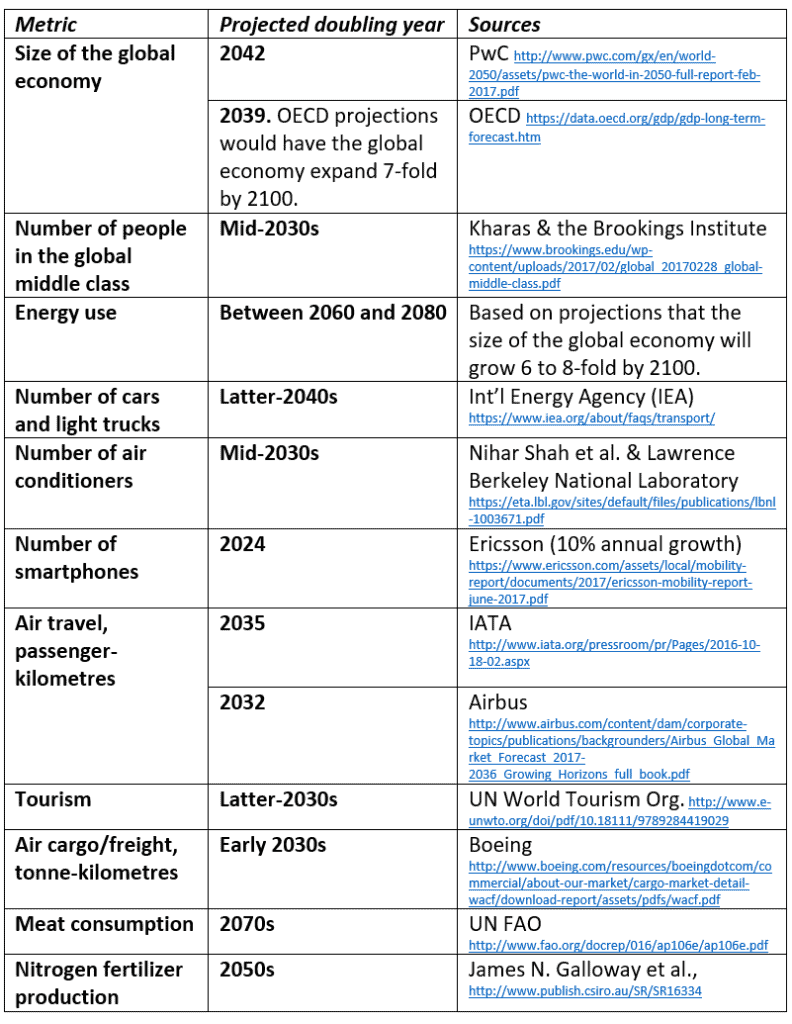
PwC’s report tells us that between now and 2050, the size of the global economy will more than double.  Other reports concur (See the OECD data here).  And this doubling of the size of the global economy is just one metric—just one aspect of the exponential growth around us.  Indeed, between now and the middle decades of this century, nearly everything is projected to double.  This table lists just a few examples.

Table of projected year of doubling for various energy, consumption, transport, and other metrics
Projected year of doubling for selected energy, consumption, and transport metrics

At least one thing, however, is supposed to fall to half

While we seem committed to doubling everything, the nations of the world have also made a commitment to cut greenhouse gas (GHG) emissions by half by the middle decades of this century.  In the lead-up to the 2015 Paris climate talks, Canada, the US, and many other nations committed to cut GHG emissions by 30 percent by 2030.  Nearly every climate scientist who has looked at carbon budgets agrees that we must cut emissions even faster.  To hold temperature increases below 2 degrees Celsius relative to pre-industrial levels, emissions must fall by half by about the 2040s, and to near-zero shortly after.

Is it rational to believe that we can double the number of cars, airline flights, air conditioners, and steak dinners and cut global GHG emissions by half?

To save the planet from climate chaos and to spare our civilization from ruin, we must—at least in the already-rich neighborhoods—end the doubling and redoubling of economic activity and consumption.  Economic growth of the magnitude projected by PwC, the OECD, and nearly every national government will make it impossible to cut emissions, curb temperature increases, and preserve advanced economies and stable societies.  As citizens of democracies, it is our responsibility to make informed, responsible choices.  We must choose policies that curb growth.

Graph source: PriceWaterhouseCoopers

$20 TRILLION: US national debt, and stealing from the future

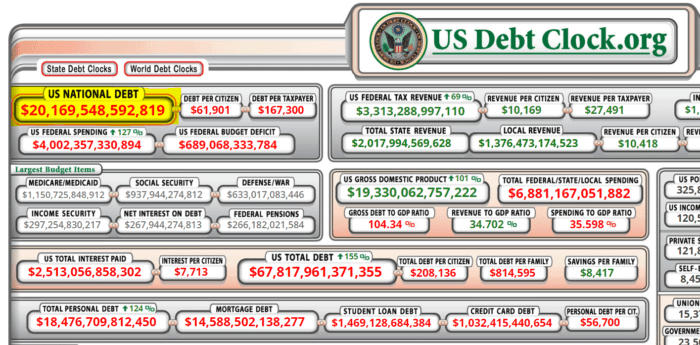
Debt clock showing that the US national debt has topped $20 trillion

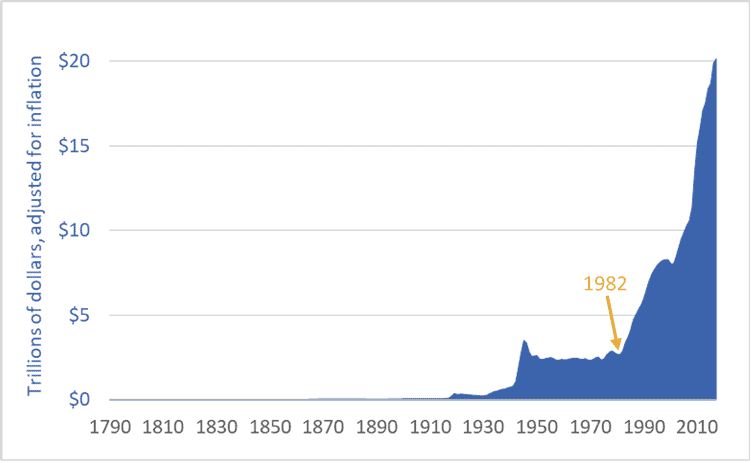
Bang!  Last week, US national debt broke through the $20 trillion mark.  As I noted in a previous post (link here), debt of this magnitude works out to about $250,000 per hypothetical family of four.

Moreover, US national debt is rising faster than at any time in history.  Adjusted for inflation, the debt is seven times higher than in 1982 ($20 trillion vs. $2.9 trillion).  Indeed, it was in 1982—not 2001 or 2008—that US government debt began its unprecedented (and probably disastrous) rise.

The graph below shows US debt over the past 227 years.  The figures are adjusted for inflation (i.e., they are stated in 2017 US dollars).

Graph of US national debt, historic, 1790 to 2017
United States national debt, adjusted for inflation, 1790-2017

It’s important to understand what is happening here: the US is transferring wealth from the future into the present.  The United States government is not merely engaging in some Keynesian fiscal stimulus, it is not simply borrowing for a rainy day (or 35 years of rainy days), it is not just taking advantage of low interest rates to do a bit of infrastructural fix-up or job creation, and it is not just responding to the financial crisis of 2008.  No.  The US government, the nation’s elites, its corporations, and its citizens are engaging in a form of temporal imperialism—colonizing the future and plundering its wealth.  They are today spending wealth that, if this debt is ever to be repaid, will have to be created by workers toiling in decades to come.

You cannot understand our modern world unless you understand this: Fossil-fueled consumer-industrial economies such as those in the US, Canada, and the EU draw heavily from the future and the past.

We reach back in time hundreds-of-millions of years to source the fossil fuels to power our cars and cities.  We are increasingly reliant on hundred-million-year-old sunlight to feed ourselves—accessing that ancient sunshine in the form of natural gas we turn into nitrogen fertilizer and enlarged harvests.  At the same time, we irrigate many fields from fossil aquifers, created at the end of the last ice age and now pumped hundreds of times faster than they refill.  We extract metal ores concentrated in the distant past.  And the cement in the concrete that forms our cities is the calcium-rich remnants of tiny sea creatures that lived millions of years ago.  We have thrust the resource-intake pipes for our food, industrial, and transport systems hundreds-of-millions of years into the past.

We also reach forward in time, consuming the wealth of future generations as we borrow and spend trillions of dollars they must repay; live well in the present at the expense of their future climate stability; deplete resources, clear-cut ecosystems, extinguish species, and degrade soils and water supplies.  We consume today and push the bills into the future.  This is the real meaning of the news that US national debt has now topped $20 trillion.

Graph sources: U.S. Department of the Treasury, “TreasuryDirect: Historical Debt Outstanding–Annual”  (link here

Earning negative returns: Energy use in modern food systems

Graph of energy use in the U.S. food system
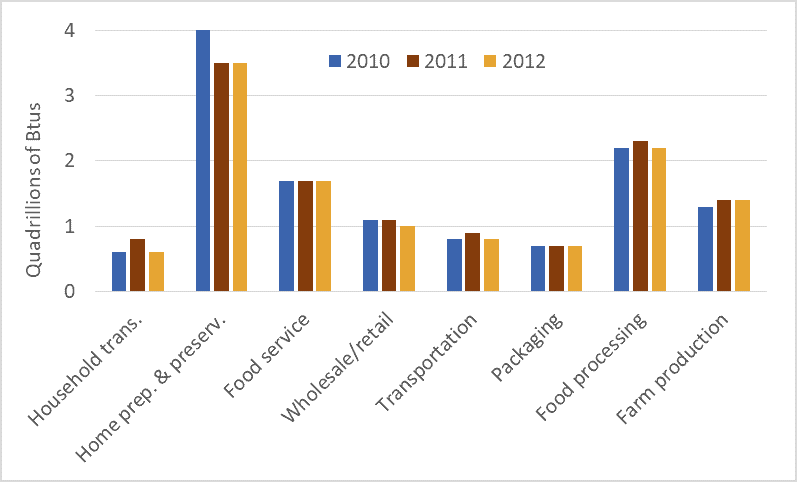
Energy use in the U.S. food system, 2010, 2011, and 2012

Humans eat food and food gives us energy.  Some humans use some of that energy to move their bodies and limbs to produce more food.  Our great-grandparents ate hearty breakfasts and used some of that food energy to power their work in fields or gardens.  Here’s the important part: until the fossil fuel age, our food production work had to produce more energy than it required.  We had to achieve positive returns on our energy investments.  If we expended 1 Calorie of energy working in the field, the resulting food had to yield 3, 4, 5, or more Calories, or else we and those who depended upon us would starve.

Pioneering research by David and Marcia Pimentel and others show that traditional food systems yielded positive returns.  The Pimentels’ book, Food, Energy, and Society, documents that for every unit of energy that a traditional farmer (i.e., no fossil fuels) put into cultivating and harvesting corn or other crops, that farmer received back 5 to 10 units.  For almost the entire 10,000-year history of agriculture, food systems were net energy producers.  Food powered  societies and civilizations.

In the 20th century we did something unprecedented: we turned human food systems from energy sources into energy sinks.  Today, for every Calorie consumed in North America, 13.3 Calories (mostly in the form of fossil fuels) have been expended.  This calculation includes all energy use in the food system: farm production, transport, processing, packaging, retailing, in-home food preservation and cooking, energy use in restaurants, etc.  It also takes into account the fact that 30 to 40 percent of all food produced is thrown away.

Traditional food systems generated an energy return on investment (EROI) of between 5:1 and 10:1.  Because our modern food system returns one unit of energy for every 13.3 invested, the EROI works out to just 0.08:1.*

The graph above shows energy use in the US food system in the years 2010, 2011, and 2012.  The data is from a recent report published by the USDA.  It shows very high levels of energy use throughout the entire food system.  Perhaps surprising, aggregate food-related energy use in US homes—running refrigerators, powering ovens, washing dishes—far exceeds aggregate energy use on US farms.  Similarly, energy use in food services (food served in restaurants, hospitals, prisons, care homes, etc.) also exceeds energy use on farms.  This data shows that the entire food system is very energy costly.  As we’re forced to curtail fossil fuel use we will be forced to dramatically transform all parts of our food systems.

* This comparison does not take into account the firewood used to cook meals in traditional systems.  But even taking that into account we still find that traditional systems have EROI values that were (and are) large multiples of the EROI values for fossil-fueled systems.

Graph source: Canning, Rehkamp, Waters, and Etemadnia, The Role of Fossil Fuels in the U.S. Food System and the American Diet (USDA, 2017)