Moore’s Law and me

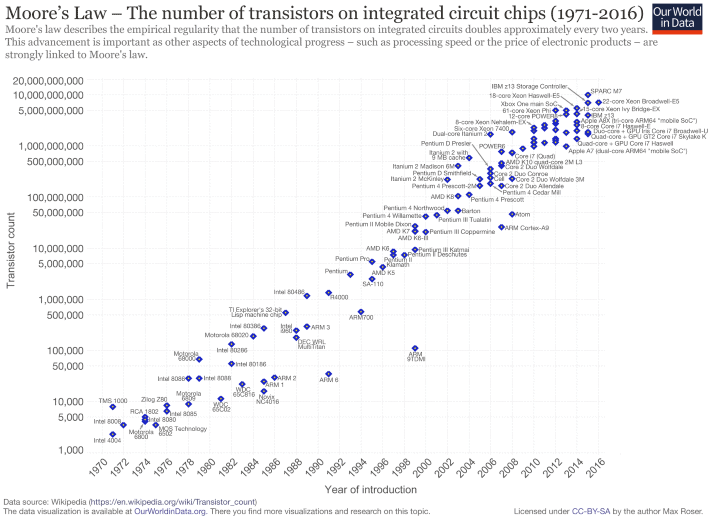
Graph of Transistor count and Moore's Law, 1970-2016
Transistor count and Moore's Law, 1970-2016

In 1985 I bought an Apple Macintosh computer.  It cost $3,500 ($7,000 in today’s dollars).  Soon after, Apple and other companies started selling external hard-disk drives for the Mac.  They, too, were expensive.  But in 1986 or ’87 the price for a hard disk came down to an “affordable” $2,000, and I and many Mac owners were tempted.  In the mid-1980s, a 20-megabyte (MB) hard drive cost $2,000 ($4,000 in today’s dollars).  That’s $200 per MB (in today’s dollars).

Fast forward to 2018.  On my way home last week I stopped by an office-supply store and paid $139 for a 4 terabyte (TB) hard drive.  That’s $34 per TB.

What would that 4 TB hard drive have cost me if prices had remained the same as in the 1980s?  Well, one terabyte is equal to a million megabytes.  So, that 4 TB drive contains 4 million MBs.  At $200 per MB (the 1980s price) the hard drive I picked up from Staples would have cost me $800 million dollars—not much under a billion once I paid sales taxes.  But it didn’t cost that: it was just $139.  Hard disk storage capacity has become millions of times cheaper in just over a generation.  Or, to put it another way, for the same money I can buy millions of times more storage.

I can reprise these same cost reductions, focusing on computer memory rather than hard disk capacity.  My 1979 Apple II had 16 kilobytes of memory.  My recently purchased Lenovo laptop has 16 gigabytes—a million times more.  Yet my new laptop cost a fraction of the inflation-adjusted prices of that Apple II.  Computer memory is millions of times cheaper.  The same is true of processing power—the amount of raw computation you can buy for a dollar.

The preceding trends have been understood for half a century—the basis for Moore’s Law.  Gordon Moore was a founder of Intel Corporation, one of the world’s leading computer processor and “chip” makers.  In 1965, Moore published a paper in which he observed that the number of transistors in computer chips was doubling every two years, and he predicted that this doubling would go on for some years to come.  (See this post for data on the astronomical rate of annual transistor production.)  Related to Moore’s Law is the price-performance ratio of computers.  Loosely stated, a given amount of money will buy twice as much computing power two or three years from now.

The graph above illustrates Moore’s Law and shows the transistor count for many important computer central processing units (CPUs) over the past five decades. (Here’s a link to a high-resolution version of the graph.)  Note that the graph’s vertical axis is logarithmic; what appears as a doubling is actually a far larger increase.  In the lower-left, the graph includes the CPU from my 1979 Apple II computer, the Motorola/MOS 6502.  That CPU chip contained about 3,500 transistors.  In the upper right, the graph includes the Intel i7 processor in my new laptop. That CPU contains about 2,000,000,000 transistors—roughly 500,000 times more than my Apple II.

Assuming a doubling every 2 years, in the 39 years between 1979 (my Apple II) and 2018 (My Lenovo) we should have seen 19.5 doublings in the number of transistors—about a 700,000-fold increase.  This number is close to the 500,000-fold increase calculated above by comparing the number of transistors in a 6502 chip to the number in an Intel i7 chip.  Moreover, computing power has increased even faster than the huge increases in transistor count would indicate.  Computer chips cycle faster today, and they also sport sophisticated math co-processors and graphics chips.

In terms of civilization and the future, the key questions include: can these computing-power increases continue?  Can the computers of the 2050s be hundreds-of-thousands of times more powerful than those of today?  Can we continue making transistors smaller and packing twice as many onto a chip every two years?  Can Moore’s Law continue unabated?  Probably not.  Transistors can only be made so small.  The rate of increase in computing power will slow.  We won’t see a million-fold increase in the coming 40 years like we saw in the past 40.  But does that matter?  What if the rate of increase in computing power fell by half—to a doubling every four years instead of every two?  That would mean that in 2050 our computers would still be 256 times more powerful than they are now.  And in 2054 they would be 512 times more powerful.  And in 2058, 1024 times more powerful.  What would it mean to our civilization if each of us had access to a thousand times more computing power?

One could easily add a last, pessimistic paragraph—noting the intersection between exponential increases in computing power, on the one hand, and climate change and resource limits, on the other.  But for now, let’s leave unresolved the questions raised in the preceding paragraph.  What is most important to understand is that technologies such as solar panels and massively powerful computers give us the option to move in a different direction.  But we have to choose to make changes.  And we have to act.  Our technologies are immensely powerful, but our efforts to use those technologies to avert calamity are feeble.  Our means are magnificent, but our chosen ends are ruinous.  Too often we become distracted by the novelty and power of our tools and fail to hone our skills to use those tools to build livable futures.

 

There are just two sources of energy

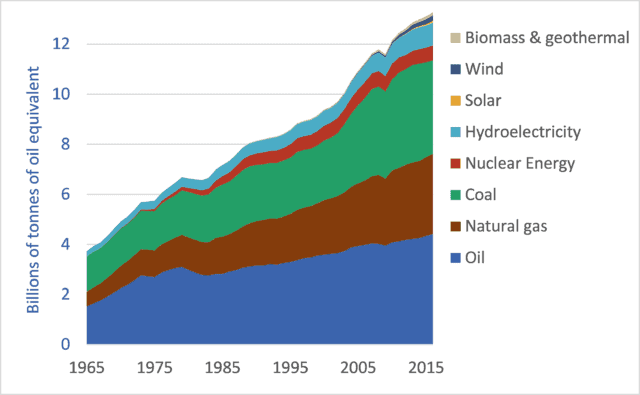
Graph of global primary energy supply by fuel or energy source, 1965-2016
Global primary energy consumption by fuel or energy source, 1965-2016

Our petro-industrial civilization produces and consumes a seemingly diverse suite of energies: oil, coal, ethanol, hydroelectricity, gasoline, geothermal heat, hydrogen, solar power, propane, uranium, wind, wood, dung.  At the most foundational level, however, there are just two sources of energy.  Two sources provide more than 99 percent of the power for our civilization: solar and nuclear.  Every other significant energy source is a form of one of these two.  Most are forms of solar.

When we burn wood we release previously captured solar energy.  The firelight we see and the heat we feel are energies from sunlight that arrived decades ago.  That sunlight was transformed into chemical energy in the leaves of trees and used to form wood.  And when we burn that wood, we turn that chemical-bond energy back into light and heat.  Energy from wood is a form of contemporary solar energy because it embodies solar energy mostly captured years or decades ago, as distinct from fossil energy sources such as coal and oil that embody solar energy captured many millions of years ago.

Straw and other biomass are a similar story: contemporary solar energy stored as chemical-bond energy then released through oxidation in fire.  Ethanol, biodiesel, and other biofuels are also forms of contemporary solar energy (though subsidized by the fossil fuels used to create fertilizers, fuels, etc.).

Coal, natural gas, and oil products such as gasoline and diesel fuel are also, fundamentally, forms of solar energy, but not contemporary solar energy: fossil.  The energy in fossil fuels is the sun’s energy that fell on leaves and algae in ancient forests and seas.  When we burn gasoline in our cars, we are propelled to the corner store by ancient sunlight.

Wind power is solar energy.  Heat from the sun creates air-temperature differences that drive air movements that can be turned into electrical energy by wind turbines, mechanical work by windmills, or geographic motion by sailing ships.

Hydroelectric power is solar energy.  The sun evaporates and lifts water from oceans, lakes, and other water bodies, and that water falls on mountains and highlands where it is aggregated by terrain and gravity to form the rivers that humans dam to create hydro-power.

Of course, solar energy (both photovoltaic electricity and solar-thermal heat) is solar energy.

Approximately 86 percent of our non-food energy comes from fossil-solar sources such as oil, natural gas, and coal.  Another 9 percent comes from contemporary solar sources, mostly hydro-electric, with a small but rapidly growing contribution from wind turbines and solar photovoltaic panels.  In total, then, 95 percent of the energy we use comes from solar sources—contemporary or fossil.  As is obvious upon reflection, the Sun powers the Earth.

The only major energy source that is not solar-based is nuclear power: energy from the atomic decay of unstable, heavy elements buried in the ground billions of years ago when our planet was formed.  We utilize nuclear energy directly, in reactors, and also indirectly, when we tap geothermal energies (atomic decay provides 60-80 percent of the heat from within the Earth).  Uranium and other radioactive elements were forged in the cores of stars that exploded before our Earth and Sun were created billions of years ago.  The source for nuclear energy is therefore not solar, but nonetheless stellar; energized not by our sun, but by another.  Our universe is energized by its stars.

There are two minor exceptions to the rule that our energy comes from nuclear and solar sources: Tidal power results from the interaction of the moon’s gravitational field and the initial rotational motion imparted to the Earth; and geothermal energy is, in its minor fraction, a product of residual heat within the Earth, and of gravity.  Tidal and geothermal sources provide just a small fraction of one percent of our energy supply.

Some oft-touted energy sources are not mentioned above.  Because some are not energy sources at all.  Rather, they are energy-storage media.  Hydrogen is one example.  We can create purified hydrogen by, for instance, using electricity to split water into its oxygen and hydrogen atoms.  But this requires energy inputs, and the energy we get out when we burn hydrogen or react it in a fuel cell is less than the energy we put in to purify it.  Hydrogen, therefore, functions like a gaseous battery: energy carrier, not energy source.

Understanding that virtually all energy sources are solar or nuclear in origin reduces the intellectual clutter and clarifies our options.  We are left with three energy supply categories when making choices about our future:
– Fossil solar: oil, natural gas, and coal;
– Contemporary solar: hydroelectricity, wood, biomass, wind, photovoltaic electricity, ethanol and biodiesel (again, often energy-subsidized from fossil-solar sources); and
– Nuclear.

Knowing that virtually all energy flows have their origins in our sun or other stars helps us critically evaluate oft-heard ideas that there may exist undiscovered energy sources.  To the contrary, it is extremely unlikely that there are energy sources we’ve overlooked.  The solution to energy supply constraints and climate change is not likely to be “innovation” or “technology.” Though some people hold out hope for nuclear fusion (creating a small sun on Earth rather than utilizing the conveniently-placed large sun in the sky) it is unlikely that fusion will be developed and deployed this century.  Thus, the suite of energy sources we now employ is probably the suite that will power our civilization for generations to come.  And since fossil solar sources are both limited and climate-disrupting, an easy prediction is that contemporary solar sources such as wind turbines and solar photovoltaic panels will play a dominant role in the future.


Graph sources: BP Statistical Review of World Energy 2017


A critically important solution to our climate crisis (and other crises)

Reconstructed wreckage of TWA Flight 800
US National Transportation Safety Board (NTSB) reconstruction of wreckage from TWA Flight 800

Ronald Wright’s A Short History of Progress is available as a book and as a five-part audio series—the 2004 CBC Massey Lectures.  (Listen here.)  In both its written and oral forms, A Short History of Progress is an accessible, eye-opening tour of humanity’s long historic journey—a look at the big picture and the long term.  It is aphoristic and packed with insights.  But one idea stands out.  Wright gets at this important idea by using the analogy of plane crashes.

Air travel today is very safe.  Mile for mile, your chances of being killed or injured while traveling on a commercial jetliner are about one one-hundredth your chances of suffering the same fate in your own car.  In 2016, zero people died in crashes of a US-based airlines operating anywhere in the world—the seventh year in a row that this was true (source here).

There’s a reason that airliners have become so safe: after every crash, well-resourced teams of highly-trained aviation experts are tasked with determining why a crash occurred, and once the cause is known the entire global aviation system implements changes to ensure that no plane in the future crashes for the same reasons.

Government agencies and airlines often expend enormous efforts to determine the cause of a crash.  The photograph above is of the reconstructed wreckage of TWA Flight 800, a Boeing 747 that crashed in 1996 after its fuel tank exploded, splitting the plane apart just ahead of the wings.  The plane crashed into the ocean off the coast of New York.  All 230 people aboard died.

The debris field covered several square miles.  In a massive effort, approximately 95 percent of the plane’s wreckage was salvaged from the sea.  The plane was painstakingly reconstructed.  And using the reconstructed plane as well as the flight data and cockpit voice recorders, the cause of the failure was traced back to a short circuit in wiring connected to the “fuel quantity indication system” in the centre fuel tank.  As a result of this investigation, changes were made to planes around the world to ensure that no similar crashes would occur.  As a result of crash investigations around the world, airlines and aircraft makers have made thousands of changes to airplane construction, crew training, air traffic control, airport security, airline maintenance, and operating procedures.  The results, as noted above, have been so successful that some years now pass without, for instance, a single fatality on a US airline.

Ronald Wright argues that the ruins and records of fallen civilizations can be investigated like airplane crash sites, and we can use the lessons we learn to make changes that can safeguard our current global civilization against similar crashes.  He writes that these ruined cities and civilizations are like “fallen airliners whose black boxes can tell us what went wrong” so that we can “avoid repeating past mistakes of flight plan, crew selection, and design.”  When Wright talks metaphorically about “flight plan,” consider our own plan to increase the size of the global economy tenfold, or more, this century.  And when he talks about crew selection, think about who’s in the cockpit in the United States.

Wright continues: “While the facts of each case [of civilizational collapse] differ, the patterns are alarmingly … similar.  We should be alarmed by the predictability of our mistakes but encouraged that this very fact makes them useful for understanding what we face today.”

Wright urges us to deploy our archaeologists, historians, anthropologists, ecologists, and other experts as crash-scene investigators—to read “the flight recorders in the wreckage of crashed civilizations,” and to take what we learn there and make changes to our own.  It is good advice.  It is, perhaps, the best advice our global mega-civilization will ever receive. 

While the crash of a jetliner may kill hundreds, the crash of our mega-civilization could kill billions.  And as more passengers pile in, as our global craft accelerates, and as the reading on the fuel-gauge drops and our temperature gauge rises, we should become more and more concerned about how we will keep our civilizational jetliner aloft through the storms to come.

Photo source: Newsday 

$20 TRILLION: US national debt, and stealing from the future

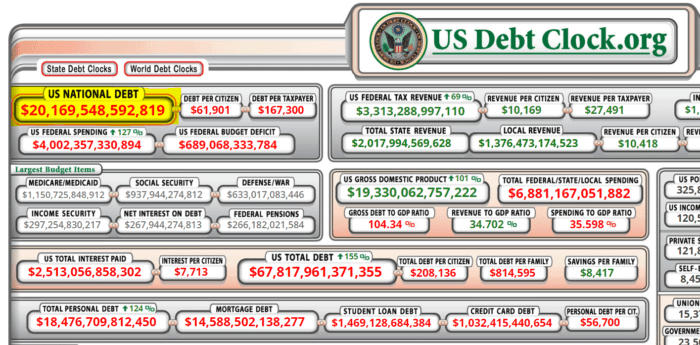
Debt clock showing that the US national debt has topped $20 trillion

Bang!  Last week, US national debt broke through the $20 trillion mark.  As I noted in a previous post (link here), debt of this magnitude works out to about $250,000 per hypothetical family of four.

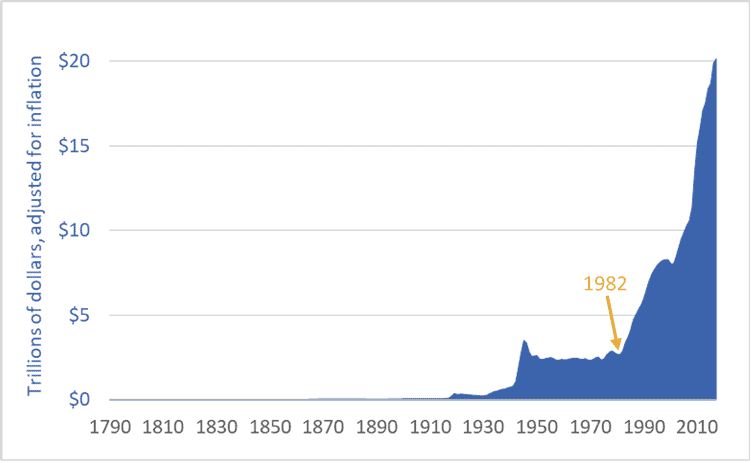
Moreover, US national debt is rising faster than at any time in history.  Adjusted for inflation, the debt is seven times higher than in 1982 ($20 trillion vs. $2.9 trillion).  Indeed, it was in 1982—not 2001 or 2008—that US government debt began its unprecedented (and probably disastrous) rise.

The graph below shows US debt over the past 227 years.  The figures are adjusted for inflation (i.e., they are stated in 2017 US dollars).

Graph of US national debt, historic, 1790 to 2017
United States national debt, adjusted for inflation, 1790-2017

It’s important to understand what is happening here: the US is transferring wealth from the future into the present.  The United States government is not merely engaging in some Keynesian fiscal stimulus, it is not simply borrowing for a rainy day (or 35 years of rainy days), it is not just taking advantage of low interest rates to do a bit of infrastructural fix-up or job creation, and it is not just responding to the financial crisis of 2008.  No.  The US government, the nation’s elites, its corporations, and its citizens are engaging in a form of temporal imperialism—colonizing the future and plundering its wealth.  They are today spending wealth that, if this debt is ever to be repaid, will have to be created by workers toiling in decades to come.

You cannot understand our modern world unless you understand this: Fossil-fueled consumer-industrial economies such as those in the US, Canada, and the EU draw heavily from the future and the past.

We reach back in time hundreds-of-millions of years to source the fossil fuels to power our cars and cities.  We are increasingly reliant on hundred-million-year-old sunlight to feed ourselves—accessing that ancient sunshine in the form of natural gas we turn into nitrogen fertilizer and enlarged harvests.  At the same time, we irrigate many fields from fossil aquifers, created at the end of the last ice age and now pumped hundreds of times faster than they refill.  We extract metal ores concentrated in the distant past.  And the cement in the concrete that forms our cities is the calcium-rich remnants of tiny sea creatures that lived millions of years ago.  We have thrust the resource-intake pipes for our food, industrial, and transport systems hundreds-of-millions of years into the past.

We also reach forward in time, consuming the wealth of future generations as we borrow and spend trillions of dollars they must repay; live well in the present at the expense of their future climate stability; deplete resources, clear-cut ecosystems, extinguish species, and degrade soils and water supplies.  We consume today and push the bills into the future.  This is the real meaning of the news that US national debt has now topped $20 trillion.

Graph sources: U.S. Department of the Treasury, “TreasuryDirect: Historical Debt Outstanding–Annual”  (link here

Efficiency, the Jevons Paradox, and the limits to economic growth

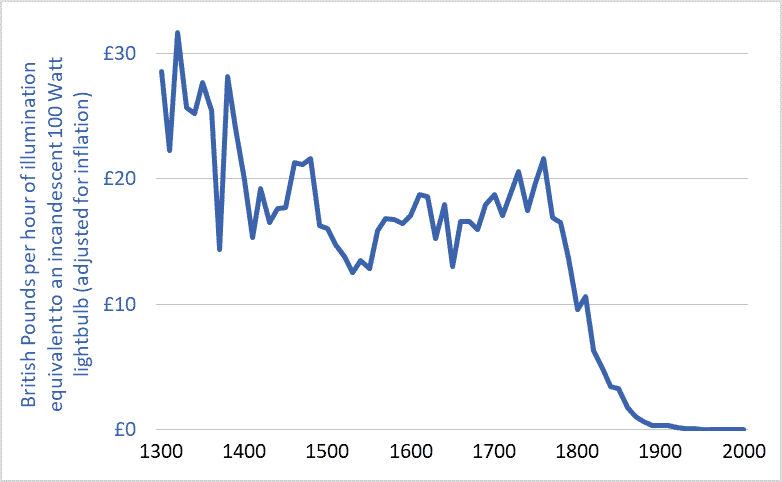
Graph of the cost of lighting in the UK, 1300-2000

I’ve been thinking about efficiency.  Efficiency talk is everywhere.  Car buyers can purchase ever more fuel-efficient cars.  LED lightbulbs achieve unprecedented efficiencies in turning electricity into visible light.  Solar panels are more efficient each year.  Farmers are urged toward fertilizer-use efficiency.  And our Energy Star appliances are the most efficient ever, as are the furnaces and air conditioners in many homes.

The implication of all this talk and technology is that efficiency can play a large role in solving our environmental problems.  Citizens are encouraged to adopt a positive, uncritical, and unsophisticated view of efficiency: we’ll just make things more efficient and that will enable us to reduce resource use, waste, and emissions, to solve our problems, and to pave the way for “green growth” and “sustainable development.”

But there’s something wrong with this efficiency solution: it’s not working.  The current environmental multi-crisis (depletion, extinction, climate destabilization, ocean acidification, plastics pollution, etc.) is not occurring as a result of some failure to achieve large efficiency gains.  The opposite.  It is occurring after a century of stupendous and transformative gains.  Indeed, the efficiencies of most civilizational processes (e.g., hydroelectric power generation, electrical heating and lighting, nitrogen fertilizer synthesis, etc.) have increased by so much that they are now nearing their absolute limits—their thermodynamic maxima.  For example, engineers have made the large electric motors that power factories and mines exquisitely efficient; those motors turn 90 to 97 percent of the energy in electricity into usable shaft power.  We have maximized efficiencies in many areas, and yet our environmental problems are also at a maximum.  What gives?

There are many reasons why efficiency is not delivering the benefits and solutions we’ve been led to expect.  One is the “Jevons Paradox.”  That Paradox predicts that, as the efficiencies of energy converters increase—as cars, planes, or lightbulbs become more efficient—the cost of using these vehicles, products, and technologies falls, and those falling costs spur increases in use that often overwhelm any resource-conservation gains we might reap from increasing efficiencies.  Jevons tells us that energy efficiency often leads to more energy use, not less.  If our cars are very fuel efficient and our operating costs therefore low, we may drive more, more people may drive, and our cities may sprawl outward so that we must drive further to work and shop.  We get more miles per gallon, or per dollar, so we drive more miles and use more gallons.  The Jevons Paradox is a very important concept to know if you’re trying to understand our world and analyze our situation.

The graph above helps illustrate the Jevons Paradox.  It shows the cost of a unit of artificial light (one hour of illumination equivalent to a modern 100 Watt incandescent lightbulb) in England over the past 700 years.  The currency units are British Pounds, adjusted for inflation.  The dramatic decline in costs reflects equally dramatic increases in efficiency.

Adjusted for inflation, lighting in the UK was more than 100 times more affordable in 2000 than in 1900 and 3,000 time more affordable than in 1800.  Stated another way, because electrical power plants have become more efficient (and thus electricity has become cheaper), and because new lighting technologies have become more efficient and produce more usable light per unit of energy, an hour’s pay for the average worker today buys about 100 times more artificial light than it did a century ago and 3,000 time more than two centuries ago.

But does all this efficiency mean that we’re using less energy for lighting?  No.  Falling costs have spurred huge increases in demand and use.  For example, the average UK resident in the year 2000 consumed 75 times more artificial light than did his or her ancestor in 1900 and more than 6,000 times more than in 1800 (Fouquet and Pearson).  Much of this increase was in the form of outdoor lighting of streets and buildings.  Jevons was right: large increases in efficiency have meant large decreases in costs and large increases in lighting demand and energy consumption.

Another example of the Jevons Paradox is provided by passenger planes.  Between 1960 and 2016, the per-seat fuel efficiency of jet airliners tripled or quadrupled (IPCC).  This, in turn, helped lower the cost of flying by more than 60%.  A combination of lower airfares, increasing incomes, and a growing population has driven a 50-fold increase in global annual air travel since 1960—from 0.14 trillion passenger-kilometres per year to nearly 7 trillion (see here for more on the exponential growth in air travel).  Airliners have become three or four times more fuel efficient, yet we’re now burning seventeen times more fuel.  William Stanley Jevons was right.

One final point about efficiency.  “Efficiency” talk serves an important role in our society and economy: it licenses growth.  The idea of efficiency allows most people to believe that we can double and quadruple the size of the global economy and still reduce energy use and waste production and resource depletion.  Efficiency is one of our civilization’s most important licensing myths.  The concept of efficiency-without-limit has been deployed to green-light the project of growth-without-end.

Graph sources: Roger Fouquet, Heat Power and Light: Revolutions in Energy Services

Full-world economics and the destructive power of capital: Codfish catch data 1850 to 2000

Graph of North Atlantic cod fishery, fish landing in tonnes, 1850 to 2000
Codfish catch, North Atlantic, tonnes per year

Increasingly, the ideas of economists guide the actions of our elected leaders and shape the societies and communities in which we live.  This means that incorrect or outdated economic theories can result in damaging policy errors.  So we should be concerned to learn that economics has failed to take into account a key transition: from a world relatively empty of humans and their capital equipment to one now relatively full.

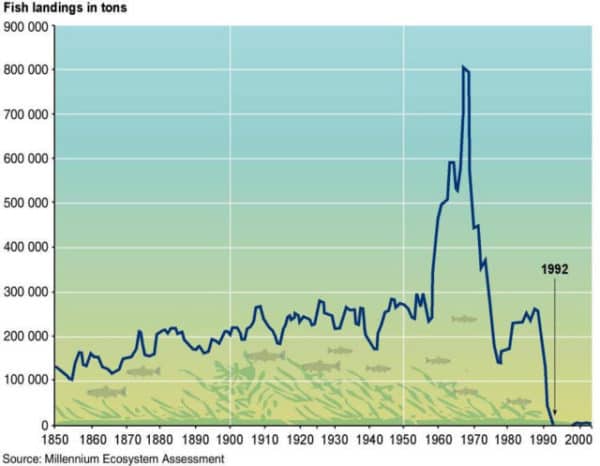
A small minority of economists do understand that we have made an important shift.  In the 1990s, Herman Daly and others developed the idea that we have shifted to “full-world economies.”  (See pages 29-40 here.)  The North Atlantic cod fishery illustrates this transition.  This week’s graph shows tonnes of codfish landed per year, from 1850 to 2000.

Fifty years ago, when empty-world economics still held, the fishery was constrained by a lack of human capital: boats, motors, and nets.  At that time, adding more human capital could have caused the catch to increase.  Indeed, that is exactly what happened in the 1960s when new and bigger boats with advanced radar and sonar systems were deployed to the Grand Banks and elsewhere.  The catch tripled.  The spike in fish landings is clearly visible in the graph above.

But in the 1970s and ’80s, a shift occurred: human capital stocks—those fleets of powerful, sonar-equipped trawlers—expanded so much that the limiting factor became natural capital: the supply of fish.  The fishery began to collapse and no amount of added human capital could reverse the decline.  The system had transitioned from one constrained by human capital to one constrained by natural capital—from empty-world to full-world economics.  A similar transition is now evident almost everywhere.

An important change has occurred.  Unfortunately, economics has not internalized or adapted to this change.  Economists, governments, and business-people still act as if the shortage is in human-made capital.  Thus, we continue our drive to amass capital—we expand our factories, technologies, fuel flows, pools of finance capital, and the size of our corporations, in order to further expand the quantity and potency of human-made capital stocks.  Indeed, this is a defining feature of our economies: the endless drive to expand and accumulate supplies of capital.  That is why our system is called “capitalism.”  And a focus on human-made capital was rational when it was in short supply.  But now, in most parts of the world, human capital is too plentiful and powerful and and, thus, destructive.  It is nature and natural capital that is now scarce and limiting.  This requires an economic and civilizational shift: away from a focus on amassing human capital and toward a focus on protecting and maximizing natural capital: forests, soils, water, fish, biodiversity, wild animal populations, a stable climate, and intact ecosystems.  Failure to make that shift will push more and more of the systems upon which humans depend toward a collapse that mirrors that of the cod stock.

Graph source:  United Nations GRID-Arendal, “Collapse of Atlantic cod stocks off the East Coast of Newfoundland in 1992


Complexity, energy, and the fate of our civilization

Tainter Collapse of Complex Societies book cover

Some concepts stay with you your whole life and shape the way you see the world.  For me, one such concept is complexity.  Thinking about the increasing complexity of our human-made systems gives a window into future energy needs, the rise and fall of economies, the structures of cities, and possibly even the fate of our global mega-civilization.

In 1988, Joseph Tainter wrote a groundbreaking book on complexity and civilizations: The Collapse of Complex Societies.  The book is a detailed historical and anthropological examination of the Roman, Mayan, Chacoan, and other civilizations.  As a whole, the book can be challenging.  But most of the important big-picture concepts are contained in chapters 4 and 6.

Regarding complexity, energy, and collapse, Tainter argues that:

1.  Human societies are problem-solving entities;
2.  Problem solving creates complexity: new hierarchies and control structures; increased reporting and information processing; more managers, accountants, and consultants;
3.  All human systems require energy, and increased complexity must be supported by increased energy use;
4.  Investment in problem-solving complexity reaches a point of declining marginal returns: (energy) costs rise faster than (social or economic) benefits; and
5.  Complexity rises to a point where available energy supplies become inadequate to support it and, in that state, an otherwise withstandable shock can cause a society to collapse.  For example, the western Roman Empire, unable to access enough bullion, grain, and other resources to support the complexity of its cities, armies, and far-flung holdings, succumbed to a series of otherwise unremarkable attacks by barbarians.

Societies certainly are problem-solving entities.  Our communities and nations encounter problems: external enemies, environmental threats, resource availability, disease, crime.  For these problems we create solutions: standing armies and advanced weaponry, environmental protection agencies, transnational energy and mining corporations, healthcare companies, police forces.

Problem-solving, however, entails costs in the form of complexity.  To solve problems we create ever-larger bureaucracies, new financial products, larger data processing networks, and a vast range of regulations, institutions, interconnections, structures, programs, products, and technologies.  We often solve problems by creating new managerial or bureaucratic roles (e.g., ombudsmen, human resources managers, or cyber-security specialist); creating new institutions (the UN or EU); or developing new technologies (smartphones, smart bombs, geoengineering, in vitro fertilization).  We accept or even demand this added complexity because we believe that there are benefits to solving problems.  And there certainly are, at least if we evaluate benefits on a case-by-case basis.  Taken as whole, however, the unrelenting accretion of complexity weighs on the system, bogs it down, increases energy requirements, and, as Tainter argues, eventually outstrips available energy supplies and sets the stage for collapse.  We should keep this in mind as we push to further increase the complexity of our civilization even as energy availability may be contracting.  Tainter is telling us that complexity has costs—costs that civilizations sometimes cannot bear.  This warning should ring in our ears as we consider the internet of things, smart-grids, globe-circling production chains, and satellite-controlled autonomous cars.  The costs of complexity must be paid in the currency of energy.

Complexity remains a powerful concept for understanding our civilization and its future even if we don’t share Tainter’s conclusion that increasing complexity sets the stage for collapse.  Because embedded in Tainter’s theory is an indisputable idea: greater complexity must be supported by larger energy inflows.  Because of their complexity, there simply cannot be low-energy versions of London, Japan, the EU, or the global trading system.  As economies grow and consumer choices proliferate and as we increase the complexity of societies here and around the world we necessarily increase energy requirements.

It is no longer possible to understand the world by watching money flows.  There are simply too many trillions of notional dollars, euros, and yen flitting through the global economy.  These torrents of e-money obscure what is really happening.  If we want to understand our civilization and its future, we must think about energy and material flows—about the physical structure and organization of our societies.  Complexity is a powerful analytical concept that enables us to do this.

Fractal collapse: How the dominant societies and economies may fail.

Six images showing the stages of formation of a Sierpinski triangle
The stages of formation of a Sierpinski triangle illustrating fractal collapse

Fractal collapse is an important, useful idea.  It helps us understand that a society, economy, political system, or civilization may not “fall,” but rather become pock-marked and weakened—shot through with micro-collapses.

The United States may be in an advanced state of collapse.  There are many indicators that this is the case.  The national debt, nearly $20 trillion, about a quarter-million dollars per family of four (see my “US national debt per family”), seems unrepayable.  America’s former industrial heartland is now mostly rustbelt, and parts of Detroit look like sets for “Walking Dead” or “The Road.”  Climate change is bearing down from one side and resource depletion from another.  Its democratic system—rotted by dark money, voter suppression, gerrymandering, the distortions of the Electoral College, and messianic populist politics—has delivered gridlock, ideologues, cartoon-level analyses of complex issues, and, now, Trump.  Many of the manufacturing jobs that have not moved to Asia may soon be taken by robots.  Inequality and incarceration-rates are at record highs.  One could extend this list to fill pages.

Despite the preceding, I’m not predicting that America (or Greece or Australia or England) will “fall”—pitch into rapid and irreversible economic contraction and social disintegration.  Instead, fractal collapse is more likely.  In fractal collapse, parts of a system fail, at various scales, but the system, in diminished form, carries on.  We’re seeing this in America.  We see the collapse of a household here (perhaps a result of the opioid crisis), and a neighbourhood, there; a city declines rapidly (think Detroit or Scranton) and a county declares bankruptcy.  Collapse occurs in various places and at various scales but the aggregate entity moves forward.  And such collapses are not predictable—they do not just happen to poor people or in the “poor” places.  Suddenly and unexpectedly, the investment banks collapse, then General Motors becomes insolvent.  The Senate and House of Representatives cease to function properly.  Collapse is not a single event.  As we are seeing it play out now—amid the hyper-energized and dominant “industrial” economies—collapse is multiple, iterative, and repeated across scales: it is fractal.

And collapse is not monolithic or pervasive.  Indeed, some parts of the system expand and prosper.  The US is manufacturing billionaires at a record pace, the stock market continues to climb, output of everything from corn to natural gas is up, and Google and Apple are world-leading corporations.  A hallmark of collapse is that societies become dis-integrated, allowing some parts to fall as other parts rise.

The image above is a Sierpinski triangle or “gasket.”  It helps visualize this idea of fractal collapse.  Step by step, the original triangle shape develops more holes and loses area, but it does not disappear.  its outlines remain apparent.

To make a Sierpinski gasket, we start with an equilateral triangle.  Then we identify the mid-points of each side and use these as the vertices of a new triangle, which we remove from the original.  (See the top-middle triangle, above.)  This leaves us with three equilateral triangles.  We repeat this process over and over; we iterate.  From each remaining triangle we remove the middle, leaving three smaller triangles.  The Sierpinski gasket and its repeated holing can serve as a visual metaphor for the fractal collapse that may now be hollowing out many of the world’s nations.

The future is not binary, not rise or fall.  Increasingly, nations may become less homogeneous.  Some parts may expand and prosper while other parts may wither or fail.  The overall trendline may not be upward, however, but rather downward.  Our future may not be a train wreck, but rather a slow dilapidation.  Not with a bang but a wimper.  We can change this outcome.  But currently very few are trying.

The intellectual history of the idea of fractal collapse is not wholly clear.  The concept came out of the physical sciences and has been popularized as a description of social and economic collapse by author and analyst John Michael Greer.

The Rule of 70

Graph of an exponential curve illustrating exponential growth and the Rule of 70.
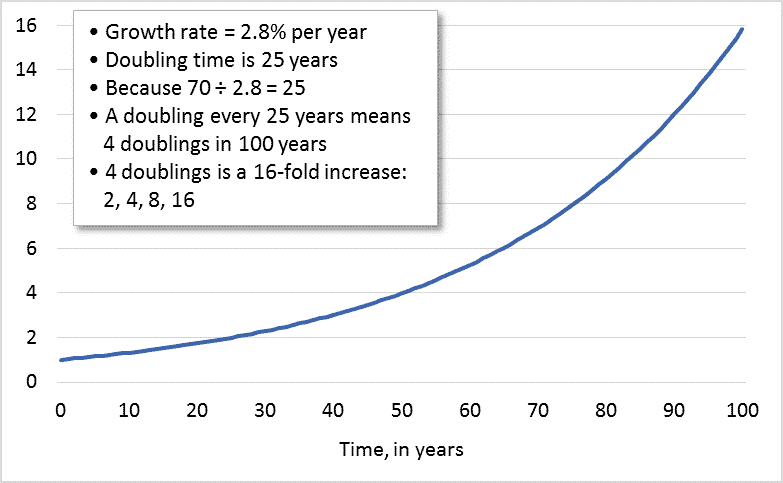
16-fold exponential increase caused by a constant 2.8 percent growth rate over 100 years

This graph’s smooth curve shows how an investment, economy, population, or any other quantity will grow at a constant rate of interest or growth—that is, at a constant percentage. In this case the percentage is 2.8 percent, compounded annually.

In the graph, in year 0 the value is 1. Soon, though, the value is twice as high, rising to 2. It doubles again to 4, doubles again to 8, and again to 16. An economy or investment growing at 2.8 percent per year will double every 25 years. Thus, it will double 4 times in a century: 2, 4, 8, 16.

There is a very useful tool for quickly calculating the doubling time for a given growth rate: the Rule of 70. If you know the percentage growth rate and want to know how long it will take an initial value to double, simply divide 70 by the rate. In this case, 70 divided by 2.8 = 25. The value doubles every 25 years and therefor increases 16-fold in 100 years.

By the Rule of 70 we can calculate that a growth rate of 7 percent will cause an initial value to double in just 10 years. China’s economy has been growing by more than 7 percent since the early 1990s. If a value—the size of China’s economy, for example—doubles every 10 years, it will go through 10 doublings in a century: 2, 4, 8, 16, 32, 64, 128, 256, 512, 1024. If China’s economy maintained a 7 percent growth rate for a century it would become more than 1,000 times larger. It is important to recall such facts the next time the Dow or some other economic indicator falls on the news that Chinese growth has “slowed” to 7 percent or less.