Self-incineration? 100 years of Australian coal production

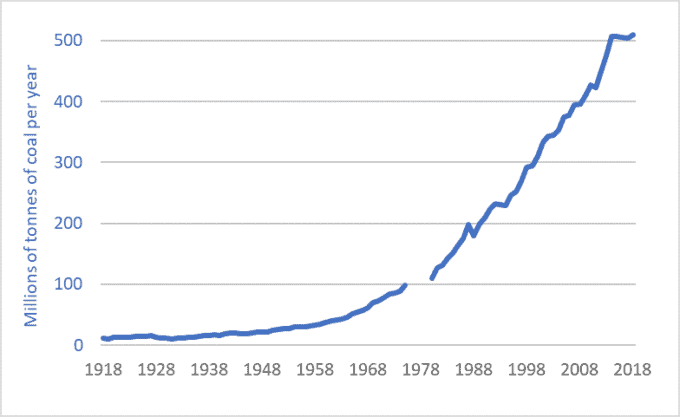
Graph of Australian coal production, historic, 1918-2018

I’m saddened and horrified by the pictures of the fires in Australia.  But the graph above gives the context for those fires and other instances of climate chaos and destruction.  To some extent, what we’re witnessing in Australia is time-delayed arson, in that humans have applied “accelerants.”

But let’s not be smug or think of this as a problem “over there.”  Graphs of Canadian and US oil production would appear nearly identical to this graph of Australian coal.  Moreover, it’s not just emissions from Australian coal that are contributing to the firestorms in that country, but Canadian and US and EU and Chinese emissions as well.  Each of us, in our flying and driving and consuming, have contributed to this carnage.  Greenhouse gas (GHG) emissions from one place will contribute to melting a glacier in another place, damaging a reef in another, and intensifying a fire in yet another.

Sadly, a major part of the Anthropocene will be the Pyrocene.  Our petro-industrial emissions are pushing the planet, biosphere, and our communities into a new age of megafires.

Let’s conclude with some insights from the coal corporations and their industry associations:

“The Australian coal industry is a key pillar of the Australian economy….  Coal benefits all Australians through its contribution to exports, wages, investment and tax revenue.  It is Australia’s comparative advantage in coal … that has helped to sustain the longest period of continuous economic growth in the nation’s history.  …  Australia [is] the fourth largest producer of black coal in the world. …  This production is possible because Australia has vast resources of coal. …  At current production rates these resources will sustain production of black coal for 125 years and lignite for over 1,200 years” [italics added].—Minerals Council of Australia, “Coal’s Economic Contribution

Sources for Graph:
– B.R. Mitchell, International Historical Statistics: The Americas and Australasia (London: The Macmillan Press, 1983), Table E2, p. 404;
– U.S. Energy Information Administration, International Energy Statistics 
See also:
– Reserve Bank of Australia, “The Changing Global Market for Australian Coal” (Bulletin – September 2019  Global Economy) 
Australian Commodity Statistics 2006, p. 244 & 245 

Methane and climate: 10 things you should know

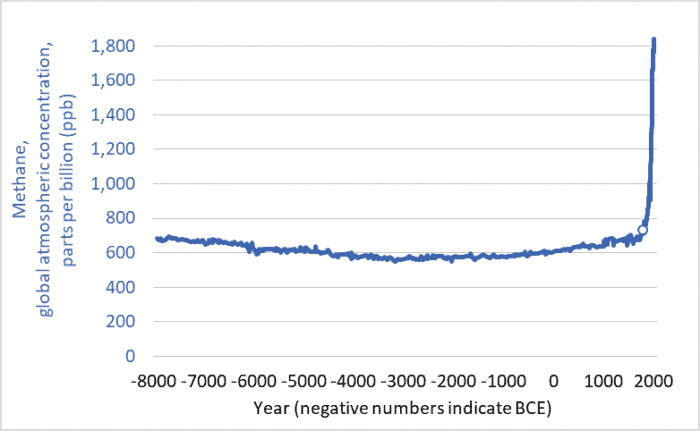
Graph of global atmospheric methane concentrations
Global atmospheric methane concentrations, past 10,000+ years (8000 BCE to 2018 CE)

The graph above shows methane concentrations in Earth’s atmosphere over the past 10,000+ years: 8000 BCE to 2018 CE.  The units are parts per billion (ppb).  The year 1800 is marked with a circle.

Note the ominous spike.  As a result of increasing human-caused emissions, atmospheric methane levels today are two-and-a-half times higher than in 1800.  After thousands of years of relatively stable concentrations, we have driven the trendline to near-vertical.

Here are 10 things you should know about methane and the climate:

1. Methane (CH4) is one of the three main greenhouse gases, along with carbon dioxide (CO2) and nitrous oxide (N2O).

2. Methane is responsible for roughly 20% of warming, while carbon dioxide is responsible for roughly 70%, and nitrous oxide the remaining 10%.

3. Methane is a powerful greenhouse gas (GHG).  Pound for pound, it is 28 times more effective at trapping heat than is carbon dioxide (when compared over a 100-year time horizon, and 84 times as effective at trapping heat when compared over 20 years).  Though humans emit more carbon dioxide than methane, each tonne of the latter traps more heat.

4. Fossil-fuel production is the largest single source.  Natural gas is largely made up of methane (about 90%).  When energy companies drill wells, “frac” wells, and pump natural gas through vast distribution networks some of that methane escapes.  (In the US alone, there are 500,000 natural gas wells, more than 3 million kilometers of pipes, and millions of valves, fittings, and compressors; see reports here and here.)  Oil and coal production also release methane—often vented into the atmosphere from coal mines and oil wells.  Fossil-fuel production is responsible for about 19% of total (human-caused and natural) methane emissions.  (An excellent article by Saunois et al. is the source for this percentage and many other facts in this blog post.)  In Canada, policies to reduce energy-sector methane emissions by 40 percent will be phased in over the next seven years, but implementation of those policies has been repeatedly delayed.

5. Too much leakage makes electricity produced using natural gas as climate-damaging as electricity from coal.  One report found that for natural gas to have lower overall emissions than coal the leakage rate would have to be below 3.2%.  A recent study estimates leakage in the US at 2.3%.  Rates in Russia, which supplies much of the gas for the EU, are even higher.  Until we reduce leakage rates, the advantage of shutting down coal-fired power plants and replacing them with natural gas generation will remain much more modest than often claimed.

6. Domestic livestock are the next largest source of methane.  Cattle, sheep,  and other livestock that graze on grass emit methane from their stomachs through their mouths.  This methane is produced by the symbiotic bacteria that live in the guts of these “ruminants” and enable them to digest grass and hay.  In addition, manure stored in liquid form also emits methane.  Livestock and manure are responsible for roughly 18% of total methane emissions.

7. Rice paddy agriculture, decomposing organic matter in landfills, and biomass burning also contribute to methane emissions.  Overall, human-caused emissions make up about 60% of the total.  And natural sources (wetlands, swamps, wild ruminants, etc.) contribute the remaining 40%.

8. There is lots of uncertainty about emissions.  Fossil fuel production and livestock may be responsible for larger quantities than is generally acknowledged.  The rise in atmospheric concentrations is precisely documented, but the relative balance between sources and sinks and the relative contribution of each source is not precisely known.

9. There is a lot of potential methane out there, and we risk releasing it.  Most of the increase in emissions in recent centuries has come from human systems (fossil fuel, livestock, and rice production; and landfills).  Emissions from natural systems (swamps and wetlands, etc.) have not increased by nearly as much.  But that can change.  If human actions continue to cause the planet to warm, natural methane emissions will rise as permafrost thaws.  (Permafrost contains huge quantities of organic material, and when that material thaws and decomposes in wet conditions micro-organisms can turn it into methane.)  Any such release of methane will cause more warming which can thaw more permafrost and release more methane which will cause more warming—a positive feedback.

Moreover, oceans, or more specifically their continental shelves, contain vast quantities of methane in the form of “methane hydrates” or “clathrates”—ice structures that hold methane stable so long as the temperature remains cold enough.  But heat up the coastal oceans and some of that methane could begin to bubble up to the surface.  And there are huge amounts of methane contained in those hydrates—the equivalent of more than 1,000 years of human-caused emissions.  We risk setting off the “methane bomb“—a runaway warming scenario that could raise global temperatures many degrees and catastrophically damage the biosphere and human civilization.

Admittedly, the methane bomb scenario is unlikely to come to pass.  While some scientists are extremely concerned, a larger number downplay or dismiss it.  Nonetheless a runaway positive feedback involving methane represents a low-probability but massive-impact risk; our day-to-day actions are creating a small risk of destroying all of civilization and most life on Earth.

10. We can easily reduce atmospheric methane concentrations and  attendant warming; this is the good news.  Methane is not like CO2, which stays in the atmosphere for centuries.  No, methane is a “short-lived” gas.  On average, it stays in the atmosphere for less than ten years.  Many natural processes work to strip it out of the air.  Currently, human and natural sources emit about 558 million tonnes of methane per year, and natural processes in the atmosphere and soils remove all but 10 million tonnes.  (again, see Saunois et al.)  Despite our huge increase in methane production, sources and sinks are not that far out of balance.  Therefore, if we stop increasing our emissions then atmospheric concentrations could begin to fall.  We might see significant declines in just decades.  This isn’t the case for CO2, which will stay in the atmosphere for centuries.  But with methane, we have a real chance of reducing atmospheric levels and, as we do so, moderating warming and slowing climate change.

A series of policies focused on minimizing emissions from the fossil-fuel sector (banning venting and minimizing leaks from drilling and fracking and from pipes) could bring the rate of methane creation below the rate of removal and cause atmospheric levels to fall.  A more rational approach to meat production (including curbing over-consumption in North America and elsewhere) could further reduce emissions.  This is very promising news.  Methane reduction represents a “low-hanging fruit” when it comes to moderating climate change.

The methane problem is the climate problem in microcosm.  There are some relatively simple, affordable steps we can take now that will make a positive difference.  But, if we don’t act fast, aggressively, and effectively, we risk unleashing a whole range of effects that will swiftly move our climate into chaos and deprive humans of the possibility of limiting warming to manageable levels.  We can act to create some good news today, or we can suffer a world of bad news tomorrow.

Graph sources:
– United States Environmental Protection Agency (US EPA), “Climate Change Indicators: Atmospheric Concentrations of Greenhouse Gases.
– Commonwealth Scientific and Industrial Research Organisation (CSIRO), “Latest Cape Grim Greenhouse Gas Data.
– National Oceanic and Atmospheric Administration (NOAA), Earth System Research Laboratory, Global Monitoring Division, “Trends in Atmospheric Methane.

Energy slaves, “hard work,” and the real sources of wealth

Stuart McMillen graphic novel Energy Slaves
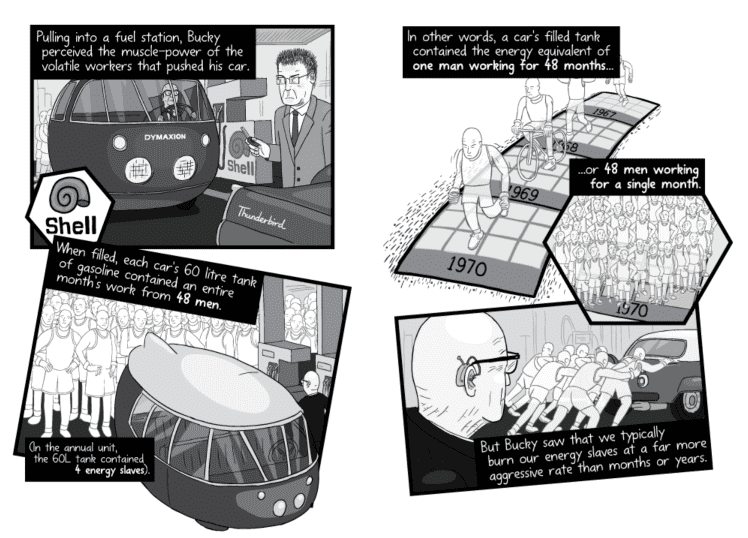
An excerpt from the online long-form comic "Energy Slaves" by Stuart McMillen

Check out this brilliant ‘long-form comic’ by Stuart McMillen: Energy Slaves.  Click here or on the URL above.

Many Canadians and Americans struggle financially.  Millions are unemployed.  Many others live paycheque-to-paycheque.  A 2017 report by the US Federal Reserve Board found that 40 percent of US citizens couldn’t cover an unexpected expense of $400 without selling something or borrowing money.  There’s a lot of denial and misunderstanding regarding the financial challenges faced by a large portion of our fellow citizens.

Equally, though, there is misunderstanding, denial, and myth-making regarding those among us who are more financially secure, those who are well off—“the rich.”  Most glaring is the way we mischaracterize the sources of our wealth, luxury, and ease.  We lie to ourselves and each other regarding why we have it so good.  The rich often claim that their wealth is a result of “hard work.”  We hear people objecting to even the smallest tax increase, saying: “I worked hard for my money and no one is going to take it from me.”

The reality, however, is quite the opposite.  The rich don’t work very hard.  Every poor women or girl in Asia or Africa who gets up at dawn to walk many kilometres to carry home water or firewood for her family works harder than the world’s multi-millionaires and billionaires.  Every farmer with a hoe or toiling behind an oxen works harder than any CEO.  My farmer grandparents worked far harder than I do, yet I live much better.  I would be self-delusional in the extreme to attribute my middle-class luxury to “hard work.”

No, those of us in North America, the European Union, and elsewhere in the world who enjoy privileged lives live well, not because we work hard, but because of the vast energy windfall of which we are the beneficiaries.  We live lives of comfort and ease because our work is done for us by “energy slaves.”

A human worker can toil at a constant rate of about one-tenth horsepower.  Working hard all year at that rate I can do about 200 horsepower-hours worth of work—hoeing or hauling or digging.  But if I add up the work accomplished by non-human energy—by fossil fuels and machines and by electricity from various sources and electric motors—I find that, on a per-capita average, that quantity is 100 times my annual work output.  For every unit of work I do, the motors and machines that surround me do 100 units.  Those of us who live comfortable, high-consumption lives are subsidized 100-to-1 by work we do not do.  And the richest among us enjoy the largest of those subsidies.

Let me state that another way: If I look around me, at the hurtling cars and trucks, the massive quantities of cloth and steel and concrete created each year, the rapidly expanding cities, the roads that get paved and the bridges built, I am seeing a quantity of building and digging and hauling and making that is 100 times greater than the humans around me could accomplish.  Human muscles and energies provide one percent of the work needed to create and maintain our towering, hyper-productive, petro-industrial civilization; but electricity, fossil fuels, other energy sources, engines, and machines provide the other 99 percent.  We and our human bodies put in 1 unit of work, but enjoy the benefits of 100.  That is the reason so many of us live better than the kings, sultans, and emperors of previous centuries.

As Stuart McMillen brilliantly illustrates in his long-form comic, Energy Slaves, it is as if each of us has a whole troupe of slaves toiling for our benefit.  It is the work of these virtual assistants that propel us along, create our homes and cities, raise our food, pump our water,  and make our goods.

We will face many hard questions as we progress through the twenty-first century: can we continue to consume energy at the rates we do now?  How can we generate that energy without fouling the atmosphere and destabilizing the climate?  How do we more equitably share access to energy among our soon-to-be 11-billion-person population?  How do we address energy poverty?  And all these questions and issues are tied to others, such as to issues of income inequality.  But a vital first step is to begin to talk honestly about the real sources of our wealth, to acknowledge that we enjoy undeserved subsidies, to admit that we are all (energy) lottery winners, and to approach the future with attitudes of humility and gratitude rather than entitlement.  We cannot navigate the future if we cling to the self-serving and self-aggrandizing myths of the past.

Civilization as asteroid: humans, livestock, and extinctions

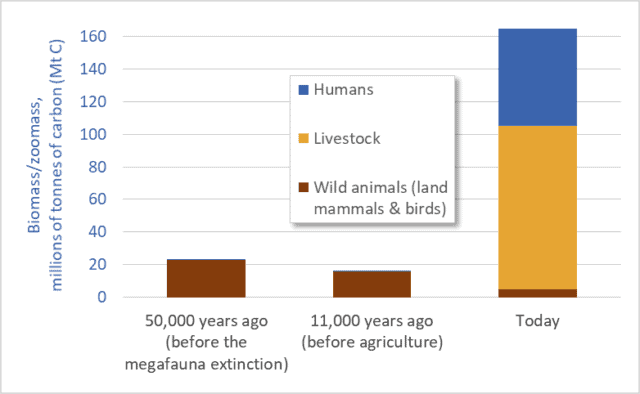
Graph of biomass of humans, livestock, and wild animals
Mass of humans, livestock, and wild animals (terrestrial mammals and birds)

Humans and our livestock now make up 97 percent of all animals on land.  Wild animals (mammals and birds) have been reduced to a mere remnant: just 3 percent.  This is based on mass.  Humans and our domesticated animals outweigh all terrestrial wild mammals and birds 32-to-1.

To clarify, if we add up the weights of all the people, cows, sheep, pigs, horses, dogs, chickens, turkeys, etc., that total is 32 times greater than the weight of all the wild terrestrial mammals and birds: all the elephants, mice, kangaroos, lions, raccoons, bats, bears, deer, wolves, moose, chickadees, herons, eagles, etc.  A specific example is illuminating: the biomass of chickens is more than double the total mass of all other birds combined.

Before the advent of agriculture and human civilizations, however, the opposite was the case: wild animals and birds dominated, and their numbers and mass were several times greater than their numbers and mass today. Before the advent of agriculture, about 11,000 years ago, humans made up just a tiny fraction of animal biomass, and domesticated livestock did not exist.  The current situation—the domination of the Earth by humans and our food animals—is a relatively recent development.

The preceding observations are based on a May 2018 report by Yinon Bar-On, Rob Phillips, and Ron Milo published in the academic journal Proceedings of the National Academy of Sciences.  Bar-On and his coauthors use a variety of sources to construct a “census of the biomass of Earth”; they estimate the mass of all the plants, animals, insects, bacteria, and other living things on our planet.

The graph above is based on data from that report (supplemented with estimates based on work by Vaclav Smil).  The graph shows the mass of humans, our domesticated livestock, and “wild animals”: terrestrial mammals and birds.  The units are millions of tonnes of carbon.*  Three time periods are listed.  The first, 50,000 years ago, is the time before the Quaternary Megafauna Extinction.  The Megafauna Extinction was a period when Homo sapiens radiated outward into Eurasia, Australia, and the Americas and contributed to the extinction of about half the planet’s large animal species (>44 kgs).  (Climate change also played a role in that extinction.)  In the middle of the graph we see the period around 11,000 years ago—before humans began practicing agriculture.  At the right-hand side we see the situation today.  Note how the first two periods are dominated by wild animals.  The mass of humans in those periods is so small that the blue bar representing human biomass is not even visible in the graph.**

This graph highlights three points:
1. wild animal numbers and biomass have been catastrophically reduced, especially over the past 11,000 years;
2. human numbers and livestock numbers have skyrocketed, to unnatural, abnormal levels; and
3. The downward trendline for wild animals visible in this graph is gravely concerning; this graph suggests accelerating extinctions.

Indeed, we are today well into the fastest extinction event in the past 65 million years.  According to the 2005 Millennium Ecosystem Assessment “the rate of known extinctions of species in the past century is roughly 50–500 times greater than the extinction rate calculated from the fossil record….”

The extinction rate that humans are now causing has not been seen since the Cretaceous–Paleogene extinction event 65 million years ago—the asteroid-impact-triggered extinction that wiped out the dinosaurs.  Unless we reduce the scale and impacts of human societies and economies, and unless we more equitably share the Earth with wild species, we will enter fully a major global extinction event—only the sixth in 500 million years.  To the other species of the Earth, and to the fossil record, human impacts increasingly resemble an asteroid impact.

In addition to the rapid decline in the mass and number of wild animals it is also worth contemplating the converse: the huge increase in human and livestock biomass.  Above, I called this increase “unnatural,” and I did so advisedly.  The mass of humans and our food animals is now 7 times larger than the mass of animals on Earth 11,000 or 50,000 years ago—7 times larger than what is normal or natural.  For millions of years the Earth sustained a certain range of animal biomass; in recent millennia humans have multiplied that mass roughly sevenfold.

How?  Fossil fuels.  Via fertilizers, petro-chemical pesticides, and other inputs we are pushing hundreds of millions of tonnes of fossil fuels into our food system, and thereby pushing out billions of tonnes of additional food and livestock feed.  We are turning fossil fuel Calories from the ground into food Calories on our plates and in livestock feed-troughs.   For example, huge amounts of fossil-fuel energy go into growing the corn and soybeans that are the feedstocks for the tens-of-billions of livestock animals that populate the planet.

Dr. Anthony Barnosky has studied human-induced extinctions and the growing dominance of humans and their livestock.  In a 2008 journal article he writes that “as soon as we began to augment the global energy budget, megafauna biomass skyrocketed, such that we are orders of magnitude above the normal baseline today.”  According to Barnosky “the normal biomass baseline was exceeded only after the Industrial Revolution” and this indicates that “the current abnormally high level of megafauna biomass is sustained solely by fossil fuels.”

Only a limited number of animals can be fed from leaves and grass energized by current sunshine.  But by tapping a vast reservoir of fossil sunshine we’ve multiplied the number of animals that can be fed.  We and our livestock are petroleum products.

There is no simple list of solutions to mega-problems like accelerating extinctions, fossil-fuel over-dependence, and human and livestock overpopulation.  But certain common sense solutions seem to present themselves.  I’ll suggest just one: we need to eat less meat and fewer dairy products and we need to reduce the mass and number of livestock on Earth.  Who can look at the graph above and come to any other conclusion?  We need not eliminate meat or dairy products (grazing animals are integral parts of many ecosystems) but we certainly need to cut the number of livestock animals by half or more.  Most importantly, we must not try to proliferate the Big Mac model of meat consumption to 8 or 9 or 10 billion people.  The graph above suggests a stark choice: cut the number of livestock animals, or preside over the demise of most of the Earth’s wild species.


* Using carbon content allows us to compare the mass of plants, animals, bacteria, viruses, etc.  Very roughly, humans and other animals are about half to two-thirds water.  The remaining “dry mass” is about 50 percent carbon.  Thus, to convert from tonnes of carbon to dry mass, a good approximation is to multiply by 2.

** There is significant uncertainty regarding animal biomass in the present, and much more so in the past.  Thus, the biomass values for wild animals in the graph must be considered as representing a range of possible values.  That said, the overall picture revealed in the graph is not subject to any uncertainty.  The overall conclusions are robust: the mass of humans and our livestock today is several times larger than wild animal biomass today or in the past; and wild animal biomass today is a fraction of its pre-agricultural value.

Graph sources:
– Yinon M. Bar-On, Rob Phillips, and Ron Milo, “The Biomass Distribution on Earth,” Proceedings of the National Academy of Sciences, May 17, 2018.
– Anthony Barnosky, “Megafauna Biomass Tradeoff as a Driver of Quaternary and Future Extinctions,” Proceedings of the National Academy of Sciences 105 (August 2008).
– Vaclav Smil, Harvesting the Biosphere: What We Have Taken from Nature (Cambridge, MA: MIT Press, 2013).