As Alberta Premier Notley and BC Premier Horgan square off over the Kinder Morgan / Trans Mountain pipeline, as Alberta and then Saskatchewan move toward elections in which energy and pipelines may be important issues, and as Ottawa pushes forward with its climate plan, it’s worth taking a look at the pipeline debate. Here are some facts that clarify this issue:
1. Canada has committed to reduce its greenhouse gas (GHG) emissions by 30 percent (to 30 percent below 2005 levels by 2030).
2. Oil production from the tar sands is projected to increase by almost 70 percent by 2030 (From 2.5 million barrels per day in 2015 to 4.2 million in 2030).
3. Pipelines are needed in order to enable increased production, according to the Canadian Association of Petroleum Producers (CAPP) and many others.
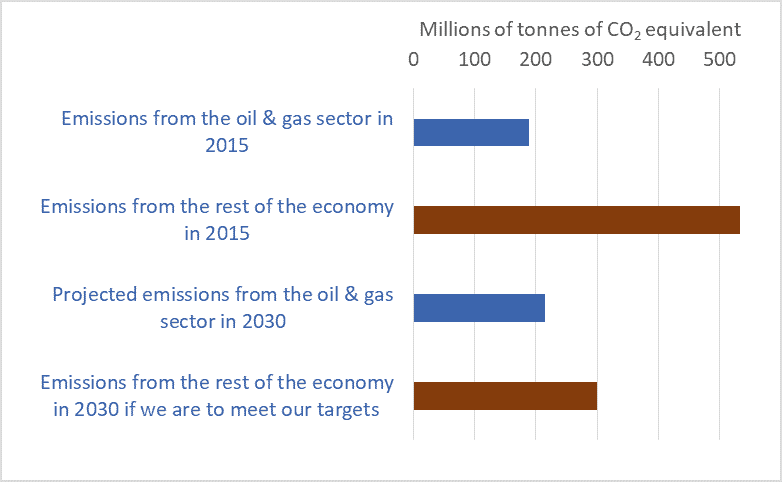
4. Planned expansion in the tar sands will significantly increase emissions from oil and gas production. (see graph above and this government report)
5. Because there’s an absolute limit on our 2030 emissions (515 million tonnes), if the oil and gas sector is to emit more, other sectors must emit less. To put that another way, since we’re committed to a 30 percent reduction, if the tar sands sector reduces emissions by less than 30 percent—indeed if that sector instead increases emissions—other sectors must make cuts deeper than 30 percent.
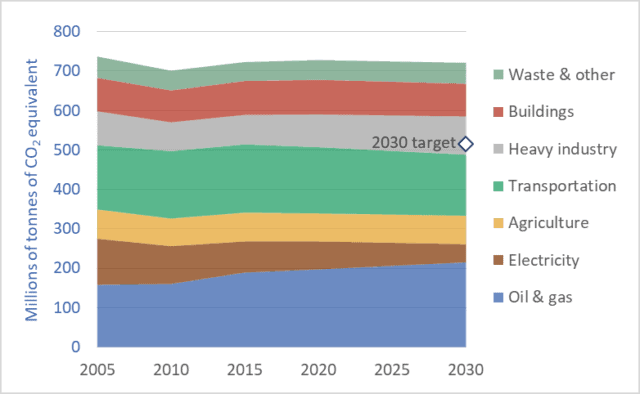
The graph below uses the same data as the graph above—data from a recent report from the government of Canada. This graph shows how planned increases in emissions from the Alberta tar sands will force very large reductions elsewhere in the Canadian economy.

Let’s look at the logic one more time: new pipelines are needed to facilitate tarsands expansion; tarsands expansion will increase emissions; and an increase in emissions from the tarsands (rather than a 30 percent decrease) will force other sectors to cut emissions by much more than 30 percent.
But what sector or region or province will pick up the slack? Has Alberta, for instance, checked with Ontario? If Alberta (and Saskatchewan) cut emissions by less than 30 percent, or if they increase emissions, is Ontario prepared to make cuts larger than 30 percent? Is Manitoba or Quebec? If the oil and gas sector cuts by less, is the manufacturing sector prepared to cut by more?
To escape this dilemma, many will want to point to the large emission reductions possible from the electricity sector. Sure, with very aggressive polices to move to near-zero-emission electrical generation (policies we’ve yet to see) we can dramatically cut emissions from that sector. But on the other hand, cutting emission from agriculture will be very difficult. So potential deep cuts from the electricity sector will be partly offset by more modest cuts, or increases, from agriculture, for example.
The graph at the top shows that even as we make deep cuts to emissions from electricity—a projected 60 percent reduction—increases in emissions from the oil and gas sector (i.e. the tar sands) will negate 100 percent of the progress in the electricity sector. The end result is, according to these projections from the government of Canada, that we miss our 2030 target. To restate: according to the government’s most recent projections we will fail to meet our Paris commitment, and the primary reason will be rising emissions resulting from tarsands expansion. This is the big-picture context for the pipeline debate.
We’re entering a new era, one of limits, one of hard choices, one that politicians and voters have not yet learned to navigate. We are exiting the cornucopian era, the age of petro-industrial exuberance when we could have everything; do it all; have our cake, eat it, and plan on having two cakes in the near future. In this new era of biophysical limits on fossil fuel combustion and emissions, on water use, on forest cutting, etc. if we want to do one thing, we may be forced to forego something else. Thus, it is reasonable to ask: If pipeline proponents would have us expand the tar sands, what would they have us contract?
Graph sources: Canada’s 7th National Communication and 3rd Biennial Report, December 2017


Really important point – which negates the Notley line that tries to pit BC’s recent responsible actions against “the whole of Canada”. But it’s actually even worse than that.
Partly because the 2030 target is grossly inadequate – see http://climateactiontracker.org/countries/canada.html.
But also because we should be addressing the supply side as well as the demand side. And on the supply side the evidence is that already-operating mines and wells (this isn’t total reserves, let alone total resource, but reserves in already-operating facilities) contain enough carbon to push us beyond 2degC of warming – see http://priceofoil.org/2016/09/22/the-skys-limit-report/
Great points, Mark. You’re right. Current Canadian targets are weak–not consistent with holding warming to 1.5 or even 2.0 degrees. The planet is on track for 3 to 4 degrees of warming, even before we contemplate tar sands expansion.
I’m not able to compare the sector-wide GHG reduction for the petroleum sector (given as a % of Canada’s overall GHG contribution) to the physical petroleum numbers given in #2. Could you please express those data in barrels of oil equivalents, tonnes of GHGs, or some other common metric?
It’s my impression that disconnection in understanding climate change, climate science and climate policy is fuelled by the barrage of numbers being thrown about. If there were more efforts to compare apples to apples, not bananas, we might see greater progress in public knowledge around climate.
Thanks, Mike. The numbers are here, in various units, aggregated and broken into categories: https://unfccc.int/files/national_reports/national_communications_and_biennial_reports/application/pdf/82051493_canada-nc7-br3-1-5108_eccc_can7thncomm3rdbi-report_en_04_web.pdf