Earlier this month, Brazilian beef packer Marfrig Global Foods announced it is acquiring 51 percent ownership of US-based National Beef Packing for just under $1 billion (USD). The merged entity will slaughter about 5.5 million cattle per year, making Marfrig/National the world’s fourth-largest beef packer. (The top-three are JBS, 17.4 million per year; Tyson, 7.7 million; and Cargill, 7.6.) To put these numbers into perspective, with the Marfrig/National merger, the largest four packing companies will together slaughter about 15 times more cattle worldwide than Canada produces in a given year. In light of continuing consolidation in the beef sector it is worth taking a look at how cattle farmers and ranchers are fairing.
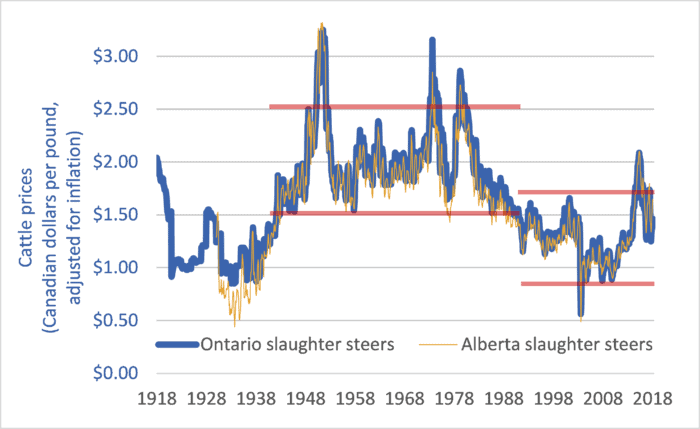
This week’s graph shows Canadian cattle prices from 1918 to 2018. The heavy blue line shows Ontario slaughter steer prices, and is representative of Eastern Canadian cattle prices. The narrower tan-coloured line shows Alberta slaughter steer prices, and is representative for Western Canada. The prices are in dollars per pound and they are adjusted for inflation.
The two red lines at the centre of the graph delineate the price range from 1942 to 1989. The red lines on the right-hand side of the graph delineate prices since 1989. The difference between the two periods is stark. In the 47 years before 1989, Canadian slaughter steer prices never fell below $1.50 per pound (adjusted for inflation). In the 28 years since 1989, prices have rarely risen that high. Price levels that used to mark the bottom of the market now mark the top.
What changed in 1989? Several things:
1. The arrival of US-based Cargill in Canada in that year marked the beginning of integration and consolidation of the North American continental market. This was later followed by global integration as packers such as Brazil-based JBS set up plants in Canada and elsewhere.
2. Packing companies became much larger but packing plants became much less numerous. Gone were the days when two or three packing plants in a given city would compete to purchase cattle.
3. Packer consolidation and giantism was faciliated by trade agreements and global economic integration. It was in 1989 that Canada signed the Canada-US Free Trade Agreement (CUSTA). A few years later Canada would sign the NAFTA, the World Trade Organization (WTO) Agreement on Agriculture, and other bilateral and multilateral “free trade” deals.
4. Packing companies created captive supplies—feedlots full of packer-owned cattle that the company could draw from if open-market prices rose, curtailing demand for farmers’ cattle and disciplining prices.
Prices and profits are only partly determined by supply and demand. A larger factor is market power. It is this power that determines the allocation of profits within a supply chain. In the late ’80s and continuing today, the power balance between packers and farmers shifted as packers merged to become giant, global corporations. The balance shifted as packing plants became less numerous, reducing competition for farmers’ cattle. The balance shifted still further as packers began to utilize captive supplies. And it shifted further still as trade agreements thrust farmers in every nation into a single, hyper-competitive global market. Because market power determines profit allocation, these shifts increased the profit share for packers and decreased the share for farmers. The effects on cattle farmers have been devastating. Since the latter-1980s, Canada has lost half of its cattle farmers and ranchers.
For more background and analysis, please see the 2008 report by the National Farmers Union: The Farm Crisis and the Cattle Sector: Toward a New Analysis and New Solutions.
Graph sources: numerous, including Statistics Canada CANSIM Tables 002-0043, 003-0068, 003-0084; and Statistics Canada “Livestock and Animal Products”, Cat. No. 23-203

