There are many kinds of climate change denial. A minority of people deny that climate change is occurring or serious. This is classic denial. But a much more common and insidious form is all around us: accepting that the problem is real, but pretending that solutions are at hand, underway, or not very difficult. By pretending that Elon Musk’s solar shingles or whiz-bang batteries can provide easy solutions, these people essentially deny the need for rapid, aggressive action. They are wrong. We are not solving the climate change problem. At worst, record high rates of fossil fuel use are locking us into civilization-threatening levels of warming. At best, we are proceeding toward solutions, but far too slowly. What we must stop denying is the need for rapid, aggressive, transformative action.
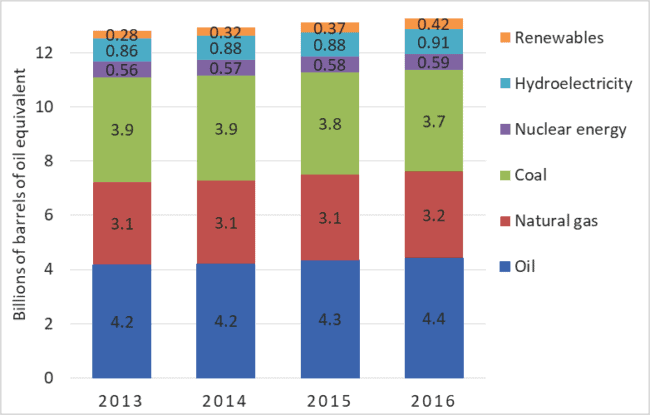
Each year British Petroleum (BP) releases a report and dataset detailing global energy supply and demand. The data includes each nation’s production and consumption of coal, oil, natural gas, hydroelectricity, and other energy sources. Some data extends back to 1965. BP provides one of the most important sources of energy information. The company’s newest dataset—updated to include 2016—was released June 13th. BP’s data shows that 2016 was another record-setting year for fossil fuel use: 11.4 billion tonnes of oil equivalent. See graph above. That same data shows that the rate of solar panel installation is slowing in nearly every nation.
The three graphs below are also produced from recently-updated BP data. They show the amount of annual increase in the production and use of solar PV electricity in various countries. This is approximately equal to the annual amount of new capacity added, but it further takes into account how much of any new capacity is actually being utilized. The North American, Asian, and European nations featured in the graphs together host 92 percent of the world’s installed solar generation capacity.
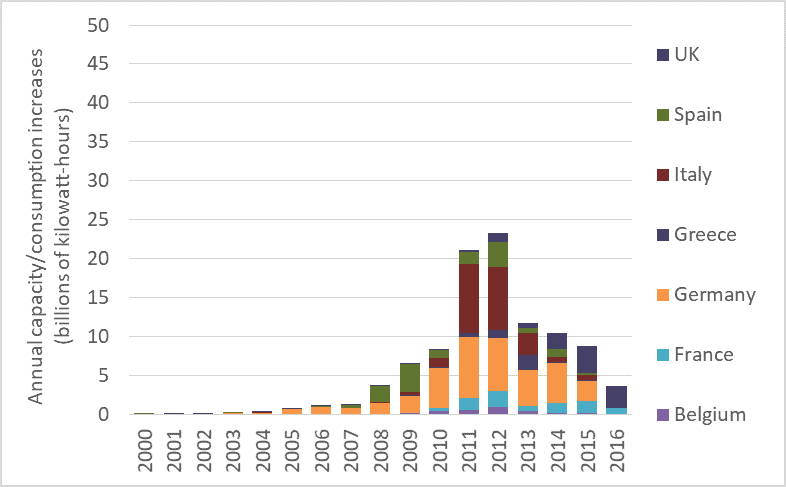
The first of the three graphs shows how much solar PV production/ consumption increased each year in selected EU countries over the past 17 years. It’s bad news: the rate of additions to solar power consumption peaked in 2012 and has fallen dramatically since then. The graph shows that the rate at which EU countries are installing solar panel arrays has collapsed since 2012. Progress toward renewables is decelerating.

Further, note how each individual country accelerated its installation then slowed. Spain, represented by the green bars, ramped up installation of solar panel arrays in 2008 and ’09. After that, solar PV additions to Spain’s grid fell sharply, and rallied in only one year: 2012. Germany’s solar installations followed a similar trajectory. In that country, annual increases in solar power production and consumption grew until 2011, then began falling. Additions to solar power production and consumption in Italy peaked in 2011 and have been falling ever since. Nearly every EU nation is slowing the rate at which they add solar power.
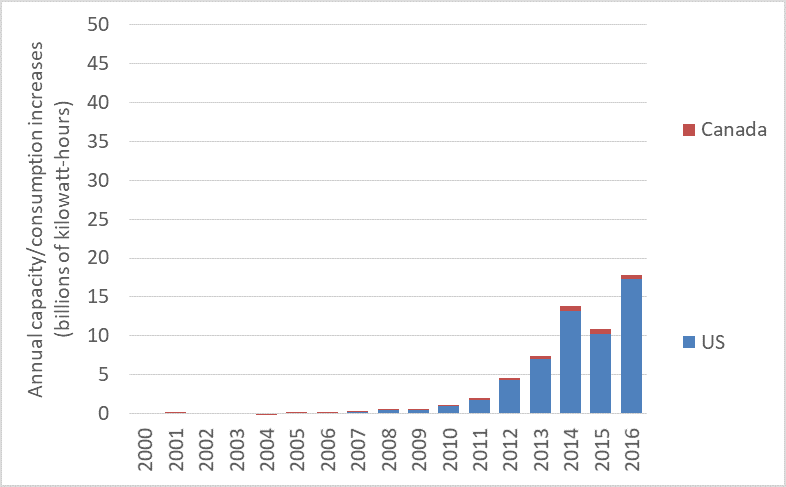
The next graph shows production/consumption additions in the US and Canada. The rates of new additions in those countries also appears to be sputtering.

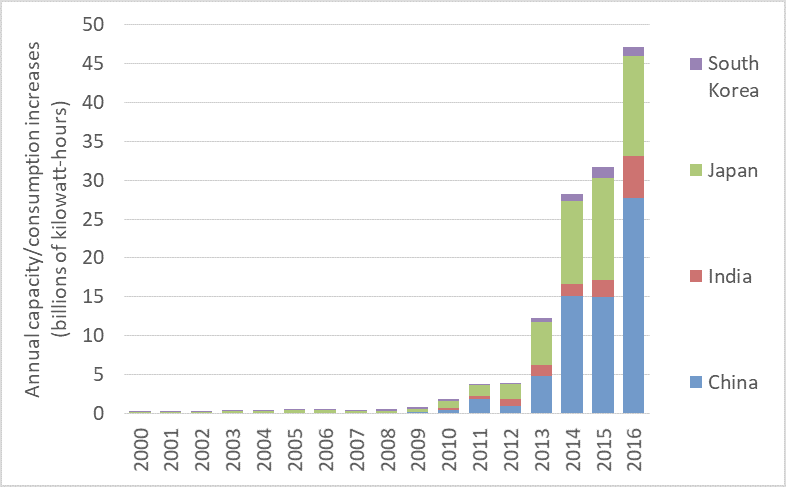
The final graph shows the rate of production/consumption increases in China, India, Japan, and South Korea. Clearly, capacity and consumption are rising rapidly in Asia. But note that rates of installation are increasing only in China and perhaps in India. One EU-based analyst told me that in recent years China ramped up solar-panel production to serve markets in the EU and elsewhere. But when demand in those markets contracted, faced with a glut of panels coming out of Chinese factories, the government there pushed to install those panels in China. Perhaps that isn’t the entire story. It may be that China’s world-leading solar install rates are partly caused by a visionary concern for the environment and the climate, and partly by the need to absorb the output of Chinese PV panel factories left with surpluses after other nations failed to maintain installation rates.

Together, these four graphs tell a disturbing story. Instead of accelerating rates of solar panel installations, we see stagnation or decline in nearly every nation other than China. This comes along-side record-high fossil fuel use and record-setting CO2 emissions. We’re failing to act aggressively enough to decarbonize global electricity systems and we are largely ignoring the project of decarbonizing our overall energy systems. Rather, we’re increasing carbon emissions. And as we do so, we risk slamming shut any window we may have had to keep global temperature increases under 2 degrees C.
Graph sources: BP Statistical Review of World Energy.


Comments are closed.