Our civilizational predicament: Doubling economic activity and energy use while cutting emissions by half

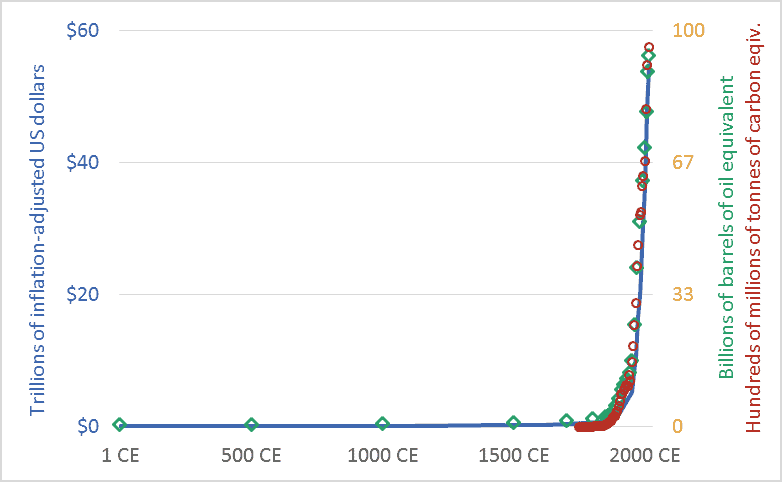
Graph of Global economic activity, energy use, and greenhouse gas emissions, 1CE to 2015CE.
Global economic activity, energy use, and carbon dioxide emissions, 1CE to 2015CE.

My friends sometimes suggest that I’m too pessimistic.  I’m not.  Rather, I’d suggest that everyone else is too optimistic.  Or, more precisely, I live in a society where people are discouraged from thinking rigorously about our predicament.  The graph above sets out our civilizational predicament, and it hints at the massive scale of the transformation that climate change requires us to accomplish in the coming decade or two.

The main point of the graph above is this: Long-term data shows that the size and speed of our global mega-civilization is precisely correlated with energy use, and energy use is precisely correlated with greenhouse gas emissions.  We have multiplied the size of our global economy and our living standards by using more energy, and this increased energy use has led us to emit more carbon dioxide and other greenhouse gases.

The graph plots three key civilizational metrics: economic activity, energy use, and carbon dioxide (CO2) emissions.  The graph covers the past 2015 years, the period from 1 CE (aka 1 AD) to 2015 CE.  The blue line depicts the size of the global economy.  The units are trillions of US dollars, adjusted for inflation.  The green diamond-shaped markers show global energy use, with all energy converted to a common measure: barrels of oil equivalent.  And the red circles show global CO2 emissions, in terms of tonnes of carbon.

Though it is seldom stated explicitly, most government and business leaders and most citizens are proceeding under the assumption that the economic growth line in the graph can continue to spike upward.  This will require the energy line to also climb skyward.  But our leaders are suggesting that the emissions line can be wrenched downward.  When people are “optimistic” about climate change, they are optimistic about doing something that has never been done before: maintaining the upward arc of the economic and energy trendlines, but somehow unhooking the emissions trendline and bending it downward, toward zero.  I worry that this will be very hard.  Most important, it will be impossibly hard unless we are realistic about what we are trying to do, and about the challenges and disruptions ahead.

We must not despair, but neither should we permit ourselves unfounded optimism.  There is a line from a great movie—the Cohen Brother’s “Miller’s Crossing”—in which the lead character, a gangster played by Gabriel Byrne, says “I’d worry a lot less if I thought you were worrying enough.”

Graph sources: GDP: Angus Maddison, The World Economy, Volume 1: A Millennial Perspective (Paris: Organization for Economic Co-operation and Development, 2001)

GHGs: Boden, T.A., Marland, G., and Andres R.J., “Global, Regional, and National Fossil-Fuel CO2 Emissions,” Carbon Dioxide Information Analysis Center (CDIAC), Oak Ridge National Laboratory, U.S. Department of Energy, Oak Ridge, Tenn., U.S.A.

Energy consumption: Vaclav Smil, Energy in Nature and Society: General Energetics of Complex Systems (Cambridge, MA: The MIT Press, 2008); British Petroleum, BP Statistical Review of World Energy: June 2016 (London: British Petroleum, 2016); pre-1500 energy levels estimated by the author based on data in Smil.

Unimaginable output: Global production of transistors

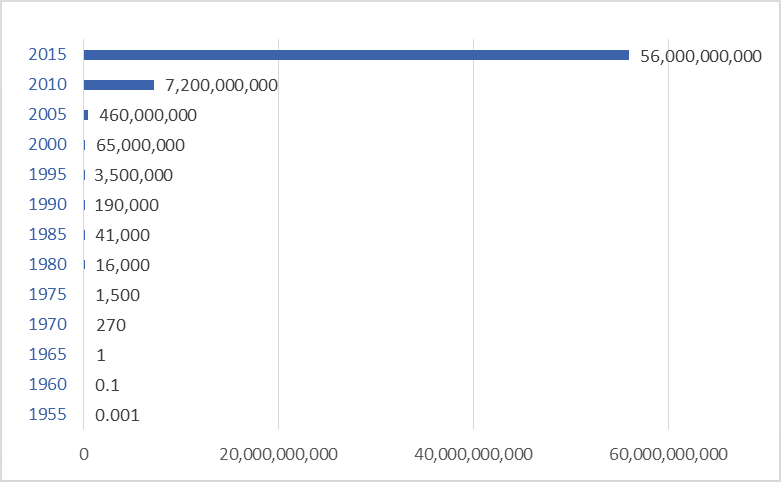
Approximate global production of transistors, per capita, selected years, 1955 to 2015

Global production of transistors has surpassed 20 trillion per second—hundreds of quintillions per year.  Transistors are the primary building blocks of modern electronic devices: computers, smartphones, TVs, radios, and other devices.  Transistors use semiconductor materials to amplify (think transistor radios) or switch (think digital computers) electronic signals and electrical power.  Transistors can be individual components, but are found in far greater numbers embedded in integrated circuits—in computer “chips.”

The graph above shows global production of transistors per year per person.  Per capita values are used here to make the size of the numbers more manageable.  In 1955, production was one transistor per 1,000 people—essentially zero.  Radios and TVs in the mid-’50s used vacuum tubes rather than transistors and integrated circuits.

Just ten years later, in 1965, production had increased 1,000-fold, to one transistor per person per year.  Transistor radios were gaining popularity in the 1960s.  Each radio contained several transistors—often 5 to 10.

While production in 1965 was one transistor per person per year, by 1975 it was nearly 1,500 per person.  Individual transistor components had been replaced by semiconductor computer chips, each containing thousands or millions of individual transistors.

The 1980s saw the proliferation of computers and home electronics.  By 1985 global production of transistors had surpassed 40 thousand per person per year.  By 2000 it was 65 million.  Today it is 56 billion per person.

The world now produces more transistors in one second that it did in one year in 1980.

The global population could not afford to purchase, on average, 56 billion transistors per person per year if prices had remained at 1965 or 1985 levels.  In the latter-1950s, a transistor radio with 5 transistors cost nearly $500 in today’s dollars.   Now, for not much more money, you can buy an iPhone that contains hundreds of billions of transistors.

A pound of rice sells for approximately one dollar and contains about 25,000 grains.  For that same dollar you can buy—as part of a memory stick or a phone—not 25,000 transistors, but billions.  A transistor today is thousands of times cheaper than a grain of rice.

Much of the news about the world is negative: famine, genocide, fisheries collapse, climate change, extinctions, resource depletion.  But we also need to acknowledge that our global hyper-civilization is truly wondrous.  We have built human systems of nearly incomprehensible power and productivity.  This is both their great strength and their great peril.  Nonetheless, if we are to safeguard some version of this civilization into the future we must appreciate and value it, despite its profound flaws.  We must take the time to understand it.  And we must work together to reform it.

Graph sources: VLSI Research.   Note that values are approximate and were derived, not directly from data, but from an existing graph.  Thus, while overall trends and conclusions are robust, individual values for specific years are approximate.

A doubling problem: 21st century exponential growth of the global economy

Graph of stylized exponential growth in the global economy
A notional graph modelling exponential growth in the global economy

When I was in grade-school, an uncle taught me something about limits, and about doubling.  He asked me: How many times can you fold a piece of paper in half?  Before I could reply, he told me that the answer was eight.  I thought this seemed too low.  So, as a child eager to demonstrate adults’ errors, I located a sheet of writing paper and began folding.  I managed seven folds—not even achieving the predicted eight.  I thought that the problem was the small size of the paper.  So, I located a newspaper, removed one sheet, and began folding.  I folded it eight times but could not make it to nine.

Why this limit?  Most people assume that the problem is the size of the sheet of paper: as we fold it, the paper gets smaller and, thus, the next fold becomes harder.  This is true, but the real problem is that the number of sheets to be folded increases exponentially.  Fold the paper once and it is two sheets thick.  A second fold brings the thickness to four sheets.  A third fold: eight.  A fourth, fifth, and sixth fold: sixteen sheets, thirty-two, then sixty-four.  The seventh fold doubles the thickness again to 128 sheets, and an eighth to 256.  When I was a child folding that sheet of newspaper, in attempting that ninth fold I was straining to bend 256 sheets.

Now, if I started with a very large piece  of paper perhaps I could prove my late uncle wrong and achieve that ninth fold.  It’s hard to predict precisely where limits lie.  Imagine a football-field-sized piece of paper and ten linebackers assigned the task of folding.  Those players could certainly make nine folds.  Perhaps they might even achieve ten, bending 512 sheets to increase the thickness to 1,024.  Maybe they could strain to make eleven folds, bending those 1,024 sheets to achieve a thickness of 2,048.  But eventually the doubling and redoubling would reach a point where it was impossible to double again.  Exponential growth creates a doubling problem.

Our petro-industrial-consumer mega-civilization has a doubling problem.  During the 20th century we doubled the size of the global economy four times.  Four doublings is a sixteenfold increase: 2, 4, 8, 16.  Despite this multiplication, today, every banker, CEO, investor, Minister of Finance, shareholder, bondholder, and would-be retiree (i.e., nearly all of us) wants to keep economic growth going.  And we want growth to continue at “normal” rates—rates that lead to a doubling in the size of the economy about every 25 years.  Thus, in effect, what we want in the 21st century is another four doublings—another sixteenfold increase.  The graph above shows the sixteenfold increase that occurred during the 20th century and shows what a sixteenfold increase during the 21st century would look like.

The first doubling of the 21st century is already underway.  We’re rapidly moving toward a global economy in 2025 that is twice the size of the one that existed in 2000.  But the economy in 2000 was already placing a heavy boot upon the biosphere.  By that year, North America’s East Coast cod fishery had already collapsed, greenhouse gas emissions were already driving up temperatures, and the Amazon was shrinking.  Despite this, we seem to believe that a 2025 economy twice as large as that year-2000 economy is “sustainable.”  Even worse, in 2025, we won’t be “sustaining” that two-times-2000 economy, we’ll be working to double it again.

Clearly, at some point, this has to stop.  Even those who think that the Earth can support and withstand a human economy twice the size that existed in 2000 must begin to have doubts about an economy four or eight times as large.  There can be no dispute that economic growth must end.  Though we may disagree as to when.

Perceptive readers will have noted a shortcoming in my paper-folding analogy: That system runs into hard limits; at some point, attempts to double the number of sheets simply fail, and that failure is immediately apparent.  Our civilizational-biospheric system is different.  Limits to Earth’s capacities to provision the human economy and absorb its wastes certainly exist, but they are not hard limits.  Given the immense power of our economy and technologies, we can breach Earth’s limits, at least for a time.  On many fronts we already have.  It will only be in hindsight—as ecosystems collapse and species disappear and the biosphere and climate become destabilized, damaged, and hostile—that we will know for sure that we’ve crossed a terrible line.  Only then will we know for sure that at some point in our past our doubling proceeded too far.  So, unlike paper folding, determining the limits of economic growth requires human wisdom and self-restraint.

Fraught freight: trade agreements, globalization, and rising global freight transport

Graph of global freight transport, trillions of tonne-kilometres
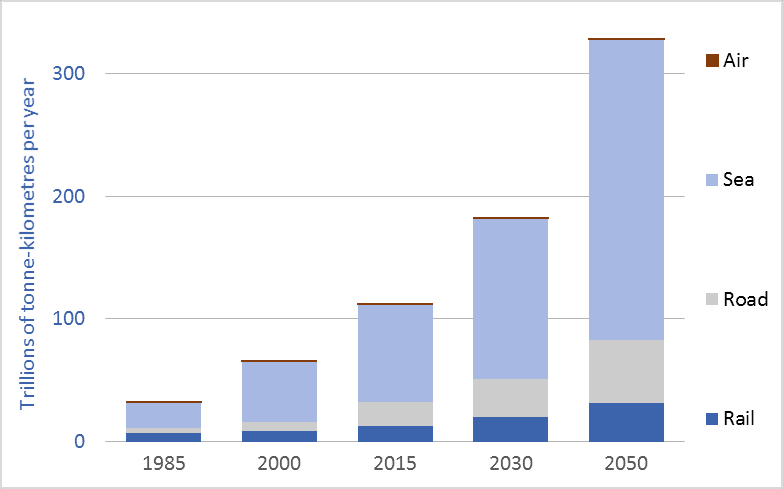
Global freight transport, all modes, trillions of tonne-kilometres, selected years, 1985 to 2050

Global freight transport now exceeds 122 trillion tonne-kilometres* per year. That enormous tonnage/distance has more than tripled since the beginning of the “free trade” era, in the 1980s.  And the Organization for Economic Cooperation and Development (OECD) projects that global freight transport tonnage will triple again in the coming generation—rising to 330 trillion tonne-kilometres per year by 2050 (see OECD).  To put these trillions into perspective, freight movement will soon surpass 100,000 tonne-kilometres per capita per year for those of us living high-consumption lifestyles, here and around the world.

*Note: a tonne-kilometre is equivalent to moving one tonne one kilometre.  If you move 10 tonnes 10 kilometres, that is 100 tonne-kilometres.

A major part of this increase in transport tonnage is related to trade agreements and globalization.  As we’ve restructured the global economy we have off-shored our factories.  Our washing machines, toasters, rubber boots, TVs, and many of our cars now come from half-way around the world.  Our foods and fertilizers are increasingly shipped across continents or oceans.  And we ship food, resources, and other goods around the world.  Economic growth means we’re consuming more and more; globalization means we’re consuming resources and products from further away.  These two trends, together, help explain the tenfold increase in global freight transport depicted in the graph.

Moving this colossal tonnage requires ships, trains, trucks, and airplanes—all of which burn fossil fuels and emit greenhouse gas (GHG) emissions.  Emissions from the freight transport sector make up about 10 percent of all man-made CO2 emissions (see OECD). The OECD predicts that if current trends and policies hold, emissions will nearly double by 2050, to 5.7 billion tonnes of CO2 per year (see OECD).  This near-doubling of freight transport emissions between now and 2050 will occur at the same time that we are attempting to cut overall GHG emissions by half.  It is time to ask the obvious questions: Is our ongoing drive toward globalization (i.e., de-localization and transport maximization) compatible with our emission-reduction commitments and a livable climate?  Indeed, as our leaders aggressively sign and implement still more “free trade” agreements (TPP, CETA, etc.) we should consider that  perhaps doubling down on globalization vetoes emissions reduction, vetoes a stable climate, vetoes local food, and vetoes local jobs.

To leave a comment, click on the graph or this post’s title and then scroll down.

Graph sources: 2015, 2030, and 2050 data from the OECD/ITF page 56. Data for 2000 and 1985 are from various sources: air freight data is from the World Bank. Rail freight data is from the World Bank. Maritime freight data is from the United Nations, Review of Maritime Transport. Road freight data for 2000 is from the OECD. Road freight data for 1985 is an informed estimate.


Too much tourism: Global air travel and climate change

Graph of global air travel, in trillions of passenger-kilometres, historic, from 1936 to 2016
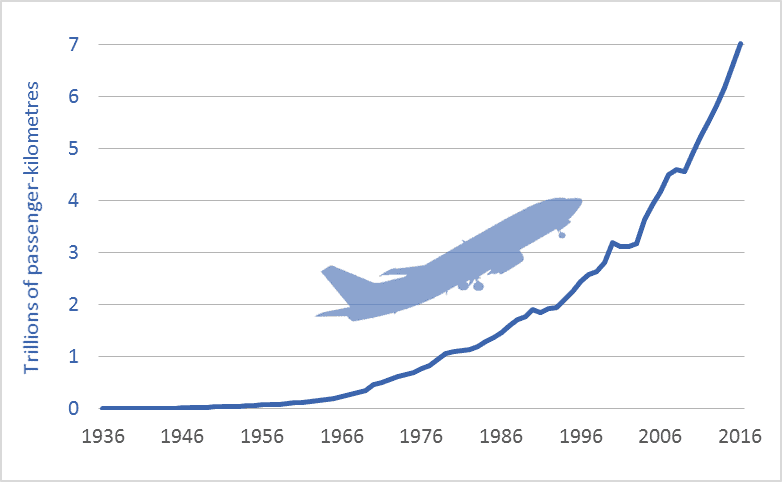
Global air travel, trillions of passenger-kilometres per year, 1936-2016

The graph above shows that global air travel is increasing exponentially. In 2016, business travelers, tourists, and others traveled more than 7 trillion passenger-kilometres by air.  As you might expect, a passenger-kilometre is equal to moving one person one kilometre. Therefore, if a plane carrying 100 people flies 1,000 kms that is equal to 100,000 passenger-kilometres (pkms).

The graph’s shape is significant; it reflects exponential growth: an ever-steeper upward curve. A system that grows exponentially doubles in a constant time-period. The amount of air travel we consume is doubling every 15 years. Thus, over the past 30 years, it has doubled twice, such that pkms were more than 4 times higher in 2016 than in 1986.

This exponential increase—this doubling and redoubling—is predicted to continue.  Aircraft manufacturer Airbus projects that pkms will double again by 2030 and continue upward (Global Market Forecast 2016). Forecasts by airline industry group International Air Transport Association and Boeing similarly project a doubling in coming years.

This projected doubling by 2030 is significant and troubling. In the lead-up to the 2015 Paris climate talks, nearly every nation pledged to reduce greenhouse gas (GHG) emissions. Canada committed to reducing its emissions by 30 percent by 2030. The United States made a similar commitment: a 26 to 28 percent reduction by 2025. One could sum up the world’s commitments, roughly, by saying we have a global goal of reducing emissions by 30 percent by 2030. Over that same period, however, Boeing, Airbus, and the world’s airlines will be working to increase global air travel by 100 percent. Something has to give. If the world’s airplane manufacturers, airlines, resort destinations, and tourist industry succeed in redoubling air travel, the resulting GHG emissions will contribute to massively destabilizing Earth’s climate.

To meet our targets to cut GHG emissions by 30 percent in just 13 years, and by perhaps 50 percent or more by mid-century, we must ground most of the airplanes and replace them with trains powered by electricity generated from renewable, low-emission sources. If a traveler must cross the ocean, then perhaps that person should travel in a plane. But within the North American continent, within Europe, within Asia, and wherever oceans do not present a barrier, travel will have to be transferred over to fast trains. And because these trains can go from city-centre to city-centre, because trains can travel at hundreds of kms per hour, and because train journeys do not require the lengthy security checks common at airports, door-to-door travel times in trains can be less than those in planes.

Citizens and travelers face a choice: keep the planes flying, continue to increase the amount we fly, increase road travel similarly, miss our emission targets by a mile, and destroy our chances of a stable, prosperous future; or invest in high-speed rail, create local jobs, and create a twenty-first century transportation system that aligns with our emission-reduction and sustainability goals.  We must ground most of the global airline fleet if we want to meet our emission-reduction goals.  And we must build a new system of fast trains if we want to meet our travel and quality-of-life goals.  Indeed, there is no reason that the factories and technologies currently in possession of aircraft makers Boeing, Airbus, Bombardier, Embraer, and other manufactures could not be repurposed to build those trains.

Graph sources: Airlines for America: Annual Results World Airlines

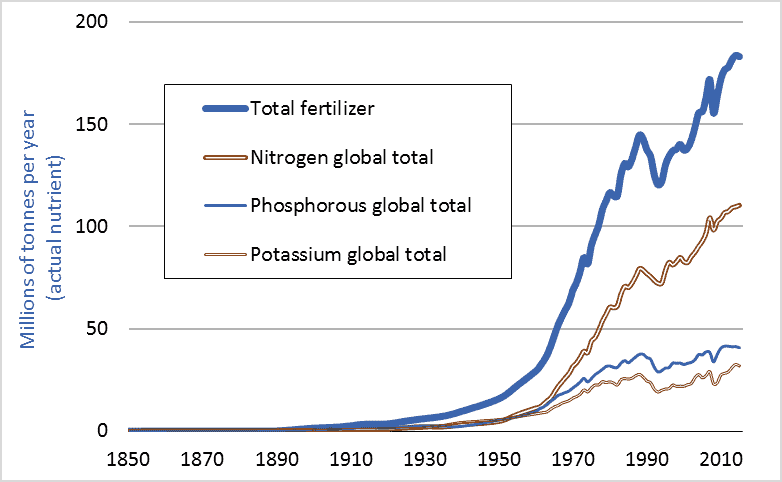
Turning fossil fuels into fertilizer into food into us: Historic nitrogen fertilizer consumption

Graph of historic global fertilizer use, including nitrogen fertilizer, 1850-2015
Global consumption of nitrogen fertilizer and other fertilizers, historic, 1850 to 2015

Last week’s blog post (Feeding the World) showed that farmers worldwide had, since 1950, quadrupled grain production. How is this possible? The answer is fertilizer; more specifically, nitrogen fertilizer. This graph shows global fertilizer use. In 1950, farmers applied less than 5 million tonnes of nitrogen (measured in terms of actual nutrient, not fertilizer product). In 2015, farmers applied more than 110 million tonnes. We managed to increase grain output fourfold largely by increasing nitrogen inputs 23-fold.

Nitrogen fertilizer is a fossil fuel product, made primarily from natural gas. One can think of a modern nitrogen fertilizer factory as having a large natural gas pipeline feeding into one end and a large pipe coming out the other carrying ammonia, a nitrogen-rich gas. To produce, transport, and apply one tonne of nitrogen fertilizer requires an amount of energy equal to almost two tonnes of gasoline. One reason we have been able to increase grain production fourfold since 1950, and human population threefold, is that we found a way to turn fossil fuels into plant nutrients into enlarged food supplies into us. With fertilizers, we can convert hydrocarbons into carbohydrates.

Dr. Vaclav Smil is an expert on the material flows, nutrient cycles, and energy transformations that underpin natural and human systems. He believes that without the capacity to turn fossil fuels into nitrogen fertilizers into enlarged harvests, nearly half the 7.4 billion people now on Earth could not be fed and could not exist. Smil calls factory-made nitrogen “the solution to one of the key limiting factors on the growth of modern civilization.” This blog highlights the many ways humans have managed to remove the limiting factors to the growth of modern civilization.

Finally, 1950 was long ago. Surely rapid increases in fertilizer consumption must have tapered off in recent years. That isn’t the case. Canadian consumption is rising especially rapidly. A look at Statistics Canada data (CANSIM 001-0069) reveals that Canadian nitrogen fertilizer consumption has increased 65 percent over the past decade (2006 to 2016). Like many countries, Canada is boosting food output by increasing the use of energy-intensive agricultural inputs.

Graph sources: Vaclav Smil, Enriching the Earth; UN FAO, FAOSTAT; International Fertilizer Industry Association, IFADATA; and Clark Gellings and Kelly Parmenter, “Energy Efficiency in Fertilizer Production and Use.”

Feeding the world: our struggle to multiply global grain production

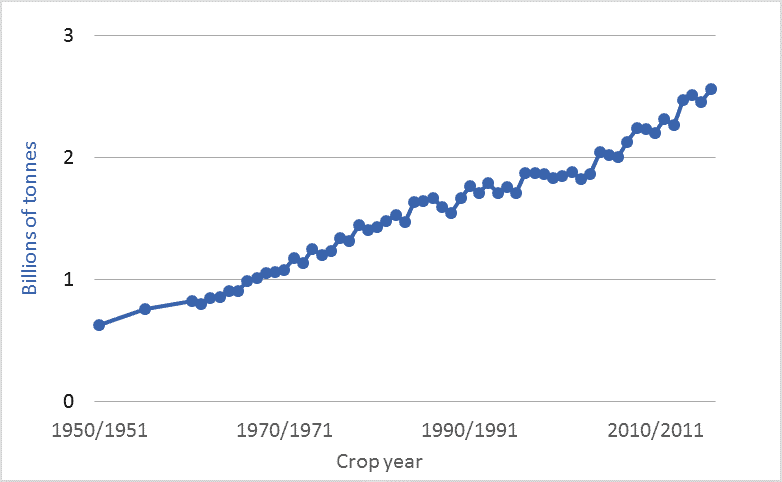
Graph of global grain production historic 1950 to 2016
Global grain production, annual, 1950–2016

This blog post and the next (Turning fossil fuels into … food) look at the rapid expansion of our global food supply and how we’ve accomplished that feat. The graph above shows world grain production for the past 66 years: 1950 to 2016. The units are billions of tonnes of annual production of all grains: primarily wheat, corn, rice, barley, oats, and millet. The figures exclude oilseeds, tonnage of which is about one-fifth as large as that of grains.

By utilizing ever-increasing inputs of water, machinery, fuels, chemicals, technologically-enhanced seeds, and, especially, fertilizers, the world’s farmers have managed to quadruple global grain production since 1950, and to double production since 1975. This expansion has been accomplished on a largely unchanged land area. Farmers have doubled output since the mid-’70s on a cropland area that, according to the UN’s Food and Agriculture Organization (FAO), has increased by just 5 percent.

The UN projects that global human population will increase by 50 percent by the end of this century, to 11.2 billion. That enlarged population will likely be richer, on average, than today’s population. Thus, per-capita meat demand will probably rise. When we feed grains to livestock, we turn 5 to 10 grain Calories into 1 meat Calorie. Thus, diets rich in meat require higher levels of grain production. Coming on top of these drivers of increased grain consumption is the likely increase in demand for biofuels, biomass, and feedstocks for “the bioeconomy.” The Global Harvest Initiative is an industry group whose members include John Deere, Monsanto, Mosaic, and Dupont. The group asserts that there is a “Global Agricultural Imperative” to “nearly double global agricultural output by 2050 to respond to a rapidly growing population and to meet the consumer demands of an expanding middle class.” If this doubling is accomplished, it will mark an 8-fold increase over 1950 production levels. Few citizens or policymakers are aware that the bounty in our supermarkets and on our tables depends upon very rapid and difficult-to-sustain rates of growth in food production.

Graph sources: 1960-2016: United States Department of Agriculture (USDA) World Agricultural Supply and Demand Estimates (WASDE),  ; 1950 and 1955: Lester Brown and Worldwatch Institute, various publications. Brown and Worldwatch cite USDA, “World Grain Database,” unpublished printout, 1991.

This isn’t normal: 2,000 years of economic growth

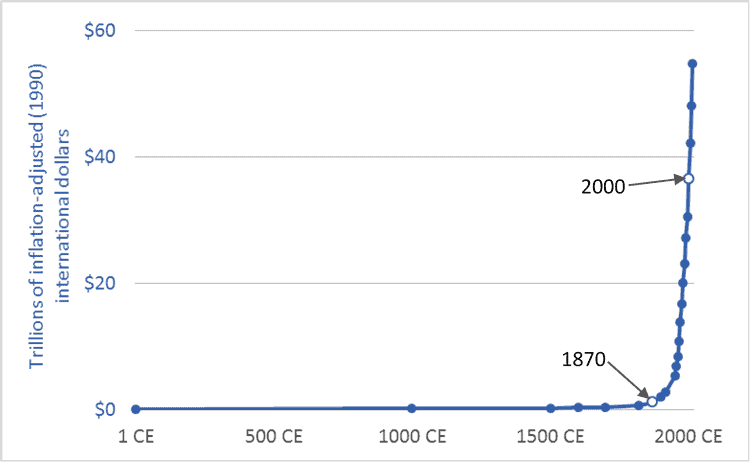
Graph of gross world product (GWP) historic, for the past two thousand years
Gross World Product (GWP) over the long term, 1 CE – 2015 CE

The graph above places our 21st century global economy in its long-term context. It plots Gross World Product (GWP), the global aggregation of Gross Domestic Product (GDP). The time frame is the past 2,015 years: 1 CE (or AD) to 2015 CE. The units are trillions of US/international dollars adjusted for inflation (converted to 1990 dollars). The main source is Angus Maddison.  Pre-20th century values are, by necessity, informed estimates by Maddison.

The year 1870 is marked with a white circle. In the millennia before 1870, the size of the global economy barely grew at all. Then, not long before the eve of the 20th century, all Hell broke loose. The most recent ten or fifteen decades appear in our historical economic record like an explosion. For perhaps 98 percent of human history, the economic trendline has been almost flat—horizontal. Over the past century-and-a-half it has been almost vertical.

The late-19th, 20th, and early 21st centuries have not been “normal.” They have been extraordinary and wondrous. Equally extraordinary is how far we have gone to normalize what is clearly an abnormal situation. Though our lifestyles and expectations are now tightly bound to near-vertical trendlines we talk and act as if nothing out of the ordinary is happening, and that we can count on more of the same for the foreseeable future.

Moreover, the 20th and 21st century exceptionalism on display in this graph is not limited to economic growth. Graphs of energy use, population, cotton or iron production, water withdrawals, food production, automobile numbers, air-travel miles, and nearly any other economic metric will look nearly identical to the graph above: millennia of little or no growth, then a sudden spike. There is upon the Earth a wholly new kind of civilization.

Graph sources: Angus Maddison, The World Economy, vol. 2, Historical Statistics (Paris: OECD, 2006) Tables 7b and 8b; and World Bank, “World DataBank: World Development Indicators: GDP at market prices” 

The Rule of 70

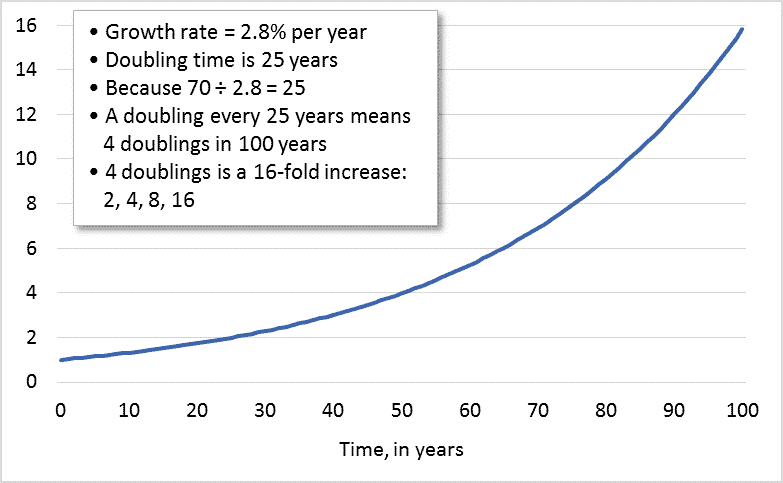
Graph of an exponential curve illustrating exponential growth and the Rule of 70.
16-fold exponential increase caused by a constant 2.8 percent growth rate over 100 years

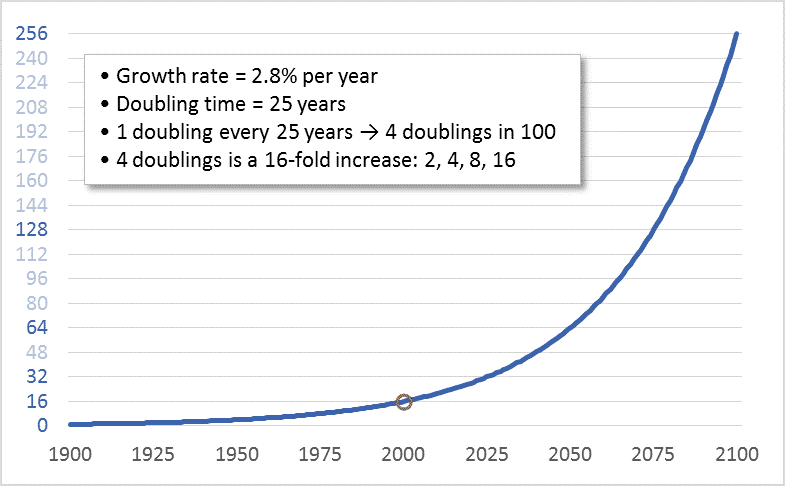
This graph’s smooth curve shows how an investment, economy, population, or any other quantity will grow at a constant rate of interest or growth—that is, at a constant percentage. In this case the percentage is 2.8 percent, compounded annually.

In the graph, in year 0 the value is 1. Soon, though, the value is twice as high, rising to 2. It doubles again to 4, doubles again to 8, and again to 16. An economy or investment growing at 2.8 percent per year will double every 25 years. Thus, it will double 4 times in a century: 2, 4, 8, 16.

There is a very useful tool for quickly calculating the doubling time for a given growth rate: the Rule of 70. If you know the percentage growth rate and want to know how long it will take an initial value to double, simply divide 70 by the rate. In this case, 70 divided by 2.8 = 25. The value doubles every 25 years and therefor increases 16-fold in 100 years.

By the Rule of 70 we can calculate that a growth rate of 7 percent will cause an initial value to double in just 10 years. China’s economy has been growing by more than 7 percent since the early 1990s. If a value—the size of China’s economy, for example—doubles every 10 years, it will go through 10 doublings in a century: 2, 4, 8, 16, 32, 64, 128, 256, 512, 1024. If China’s economy maintained a 7 percent growth rate for a century it would become more than 1,000 times larger. It is important to recall such facts the next time the Dow or some other economic indicator falls on the news that Chinese growth has “slowed” to 7 percent or less.

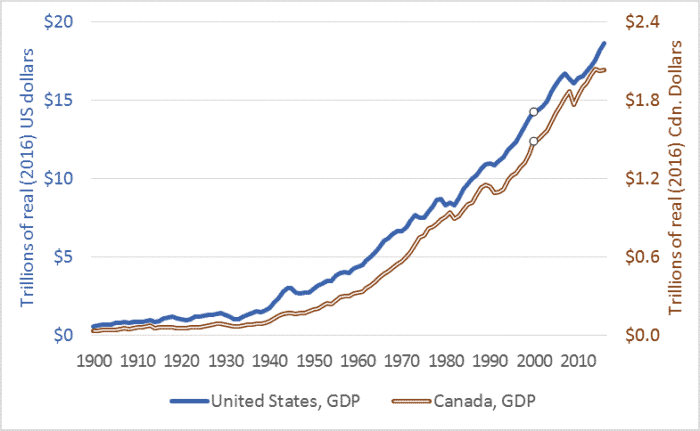
Exponential growth: US and Canadian GDP in the 20th century

US and Canadian Gross Domestic Product (GDP) historic
Canada and US Gross Domestic Product (GDP), 1900–2016

This graph shows the increasing sizes of the US and Canadian economies. The graph plots US Gross Domestic Product (GDP) on the left-hand axis, and Canadian GDP on the right. The time-frame is 1900 to 2016. The year 2000 is marked with an open circle, to highlight the 20th century. The units are trillions of US or Canadian dollars, and all figures are adjusted for inflation, that is, they are stated in 2016 dollars.

How much did these economies grow during the 20th century? US GDP in 1900 was $0.59 trillion dollars (in today’s US currency). In 2000, GDP was $14.3 trillion dollars—24 times larger. Canada’s economy in 2000 was 45 times larger than in 1900.

We can calculate the average annual growth rate. During the 20th century, the US economy grew at an average compound rate of 3.2 percent. We often hear growth rates of 2 to 3 percent described as normal. Indeed, if rates in the US or comparable nations fall below 2 percent, analysts warn of “slow growth.” Moreover, in recent years there has been consternation as Chinese economic growth rates have fallen from 9 or 10 percent per year to 7.

Can the US and comparable economies grow at rates in the 21st century that were “normal” in the 20th? Even if annual growth slows to an average of just 2 percent, the size of the US economy will increase 7-fold between 2000 and 2100. If the US economy grows at 2 percent per year throughout the 21st century, by 2100 the US economy alone will be more than twice as large as the global economy of 2000.

Growth rates of 2 or 3 percent per year, modest when considered over the short term, will, over several decades, cause an economy to double and redouble in size. Can we multiply the sizes of already-large national economies five- or ten-fold this century? Is it wise to try?

Graph sources: United States GDP: US Deptartment of Commerce, Bureau of Economic Analysis, NIPA Table 1.1.5; and Louis Johnston and Samuel Williamson, “What Was the U.S. GDP Then?” MeasuringWorth, https://www.measuringworth.com/usgdp/ . Canadian GDP: Statistics Canada CANSIM Tables 380-0566 and 384-0037; and M.C. Urquhart, “New Estimates of Gross National Product, Canada, 1870-1926…,” in Long-Term Factors in American Economic Growth, eds. Stanley Engerman and Robert Gallman (Chicago: University of Chicago Press, 1986)