Falling per-capita farmland raises critical questions

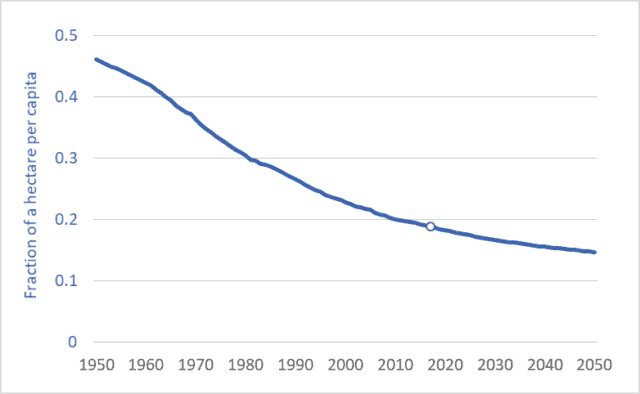
Graph of per capita farmland arable land, global, 1950 to 2050
Per-capita arable land (cropland), world average, 1950 to 2050.

As populations continue rising, per-capita farmland area is falling.  In 1950, for each person in the world (about 2.5 billion back then) there was, on average, 0.46 hectares of cropland (“arable” land).  That is an area roughly equal to the in-bounds playing area of a US football field.  Today, per-capita cropland area is just 0.19 hectares.  By 2050, it will be lower still: 0.15 hectares—one-third the area in 1950.  We’ll soon be down to just a third of a football field each.

The graph above shows the average per-capita cropland area from 1950 to 2050.  The units are fractions of a hectare.

Humanity’s in a bind.  We’re becoming more numerous.  The UN predicts a global population of 9.8 billion by mid-century.  Moreover, we’re becoming richer.  Projected rates of economic growth—3 percent compounded annually, according to the World Bank—will cause the size of the global economy to nearly triple by 2050.  That enlarged, enriched population will want to consume more food.  It will want to consume more of its food in the form of meat rather than vegetables or grains.  It will be more prone to overeating and more demanding of processed foods and junk food.  And it will waste more of its food, because comfortable, well-fed people do that.  In addition, more food will be diverted to energy and fuel uses, including biofuels for air travel and ocean shipping.  Based on these factors, the UN projects that food production in 2050 will have to be 70 percent higher than in 2005 (see here or here).

Here’s the bind.  In order to deal with climate change, the world’s governments have committed to reducing GHG emissions by 30 percent by 2030—just over 12 years from now.  And reductions of 50 to 80 percent are needed by 2050.  How do we expand food supplies and reduce emissions?  Bringing new land into production (Amazon rainforest, for example) emits huge plumes of GHGs as soil carbon is released by tillage.  If we want to reduce emissions we cannot afford to continue releasing carbon stored in forests or grasslands.  So the alternative is to intensify production—produce more on the land we already have.  This usually requires more fertilizer.  But the most used and most critical fertilizer, nitrogen, is made from natural gas and is a major source of GHG emissions.  Globally, nitrogen (N) fertilizer use has doubled since the 1970s (see blog post here); Canadian farmers have doubled their N use since the 1990s.  Our commitments to downward-trending GHG emissions is already in conflict with upward trending nitrogen fertilizer usage.

In the face of monumental problems such as these it is best to just spend some time mulling our predicament.  We must resist the “rush to solutions.”  For now, let’s just consider some questions:
– Can we continue to waste 20 to 40 percent of our food?
– Can we burn food in cars and airliners and cruise ships?
– Should we increase livestock production by two-thirds in the next three decades (as the UN predicts), knowing that many livestock production systems inefficiently turn 5 to 10 Calories worth of grain into one Calorie of meat?
– Should we continue to make bad food out of good—producing millions of tonnes of nutritionally disfigured foods such as soft drinks, cocoa puffs, and potato chips?  (One quarter of US Calories now come from junk food.  See here.)
– Should we continue to foster a food industry that promotes over-eating and resulting health problems?

As our per-capita land base contracts, and as our atmospheric emission-space fills, can we afford these extravagances?  …these follies?  An adequate response to these problem will require re-imagining and restructuring of our food system–fundamental changes to food production and consumption.

Graph sources: FAOSTAT and the UN Population Division 


Earning negative returns: Energy use in modern food systems

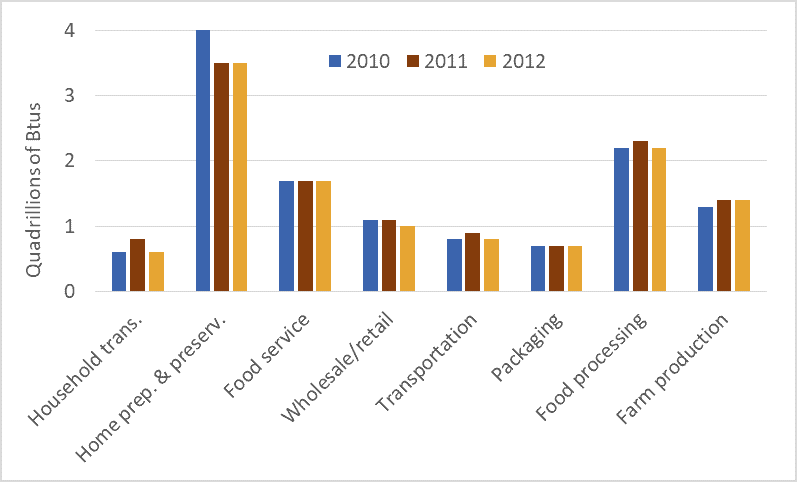
Graph of energy use in the U.S. food system
Energy use in the U.S. food system, 2010, 2011, and 2012

Humans eat food and food gives us energy.  Some humans use some of that energy to move their bodies and limbs to produce more food.  Our great-grandparents ate hearty breakfasts and used some of that food energy to power their work in fields or gardens.  Here’s the important part: until the fossil fuel age, our food production work had to produce more energy than it required.  We had to achieve positive returns on our energy investments.  If we expended 1 Calorie of energy working in the field, the resulting food had to yield 3, 4, 5, or more Calories, or else we and those who depended upon us would starve.

Pioneering research by David and Marcia Pimentel and others show that traditional food systems yielded positive returns.  The Pimentels’ book, Food, Energy, and Society, documents that for every unit of energy that a traditional farmer (i.e., no fossil fuels) put into cultivating and harvesting corn or other crops, that farmer received back 5 to 10 units.  For almost the entire 10,000-year history of agriculture, food systems were net energy producers.  Food powered  societies and civilizations.

In the 20th century we did something unprecedented: we turned human food systems from energy sources into energy sinks.  Today, for every Calorie consumed in North America, 13.3 Calories (mostly in the form of fossil fuels) have been expended.  This calculation includes all energy use in the food system: farm production, transport, processing, packaging, retailing, in-home food preservation and cooking, energy use in restaurants, etc.  It also takes into account the fact that 30 to 40 percent of all food produced is thrown away.

Traditional food systems generated an energy return on investment (EROI) of between 5:1 and 10:1.  Because our modern food system returns one unit of energy for every 13.3 invested, the EROI works out to just 0.08:1.*

The graph above shows energy use in the US food system in the years 2010, 2011, and 2012.  The data is from a recent report published by the USDA.  It shows very high levels of energy use throughout the entire food system.  Perhaps surprising, aggregate food-related energy use in US homes—running refrigerators, powering ovens, washing dishes—far exceeds aggregate energy use on US farms.  Similarly, energy use in food services (food served in restaurants, hospitals, prisons, care homes, etc.) also exceeds energy use on farms.  This data shows that the entire food system is very energy costly.  As we’re forced to curtail fossil fuel use we will be forced to dramatically transform all parts of our food systems.

* This comparison does not take into account the firewood used to cook meals in traditional systems.  But even taking that into account we still find that traditional systems have EROI values that were (and are) large multiples of the EROI values for fossil-fueled systems.

Graph source: Canning, Rehkamp, Waters, and Etemadnia, The Role of Fossil Fuels in the U.S. Food System and the American Diet (USDA, 2017)

Taking nearly the whole loaf: US and Canadian wheat and bread prices, 1975 to present

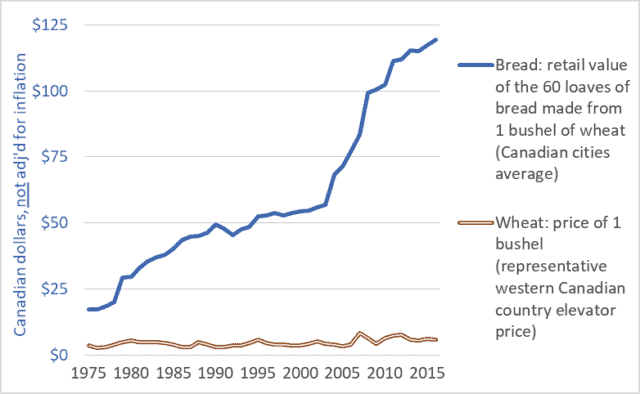
Graph of Canadian retail store bread price and country elevator wheat price, 1975-2016
Canadian retail store bread price and farm-gate wheat price, 1975-2016

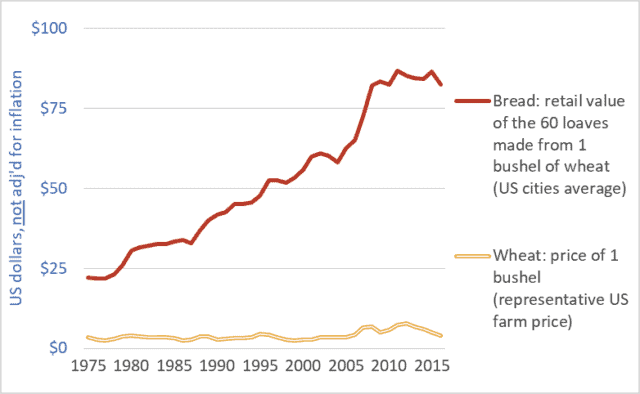
Graph of United States retail store bread price and farm-gate wheat price, 1975-2016

United States retail store bread price and farm-gate wheat price, 1975-2016

It’s been said before but it bears repeating: farmers are making too little because others are taking too much.  For instance, food retailers, processors, grain companies, and railways are taking far too large a share of the retail price of bread.  And the share taken by these companies is increasing—choking off the flow of dollars to our family farms.  At the same time, these same corporations are profiteering by driving up the prices of the staple foods we all need to feed ourselves and our families.

This week’s two graph show data for the US and Canada.  Both graphs show the price of a bushel of wheat (the relatively flat line across the bottom of each graph) and the retail value of the approximately 60 loaves of bread that can be produced from a bushel of wheat (the upward-trending line in each graph).  The wheat prices are farm-gate or country elevator values.  The units are Canadian or US dollars, as appropriate, not adjusted for inflation.

The units are not important, however.  What is important is the widening gap between what consumers pay for bread and the amount of money that makes it back to the farm.  This growing gap represents the ever-larger share taken by food retailers, flour millers and other processors, railways, and elevator companies and grain traders.

Very little of the money spent in grocery stores makes it back to American or Canadian farms.  Compounding this problem is the fact that most of the money that does make it back to these farms is quickly captured by powerful farm-input companies. (See details here.)  Corporations upstream and downstream from farmers use their market power to capture huge profits for themselves while reducing net farm income to zero in many years.  To keep farms solvent, governments and citizens must step in with taxpayer-funded farm support payments.  In Canada, these payments have totaled $100 billion dollars over the past three decades, and more than $400 billion in the US.  From some perspectives, the primary beneficiaries of these payments are the executives and shareholders of the dominant agribusiness/food corporations.

Finally, there is the issue of efficiency.  Farmers are relentlessly urged to become more efficient.  Indeed, they are forced to increase efficiency simply to remain solvent in the face of declining farm-gate prices and rising input costs.  Farmers are so efficient today that they can produce grains and other products for 1970s’ prices.  But what of efficiency elsewhere in the system?  What does it indicate about the efficiency of huge corporate flour millers and food retailers if they must constantly take more and more money for themselves?  Are they becoming less efficient as they get larger?  Or are they simply using their increasing size and power to capture more profit for themselves?  And if citizens are going to be made to pay more for food anyway, then why badger farmers to become ever more efficient?

Farmers are the primary victims of the abuses of power within the food system.  But everyone is hurt as we are made to pay increased taxes to fund farm-support programs and to pay increased retail prices to support the outsized profit needs of the dominant food-system transnationals and their shareholders.

Graph sources:
Canadian bread: Statistics Canada, Consumer Prices and Price Indexes (Catalog number 62-010); CANSIM Table 326-0012.
US bread: Bureau of Labour Statistics, “Bread prices 1980-2015“.
Canadian wheat: Government of Saskatchewan, Saskatchewan Agriculture and Agri-food, “StatFacts-Canadian Wheat Board Payments for No. 1 CWRS”; CANSIM Table  002-0043.
US Wheat: United States Department of Agriculture, “Wheat Yearbook”   

Losing the farm(s): Census data on the number of farms in Canada

Graph of the number of farms in Canada, Census years, 1911 to 2016
Number of farms in Canada, Census years, 1911 to 2016

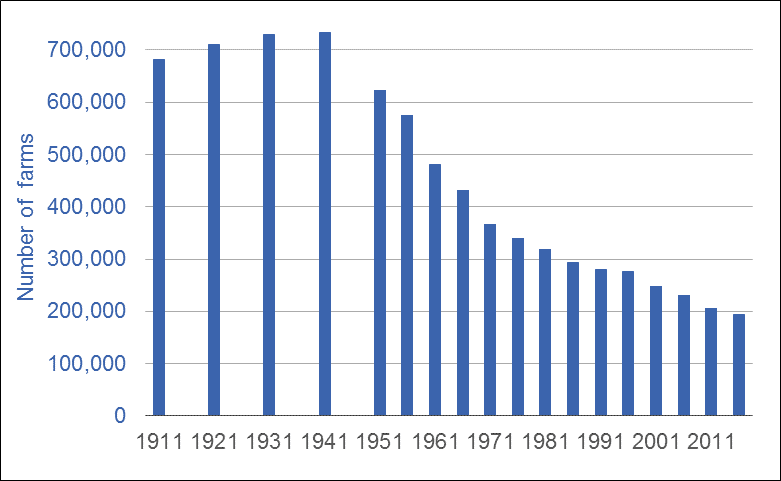
Statistics Canada conducts its Census of Agriculture every five years.  Data from the 2016 Census was just released.  It shows that the number of farms in Canada continues to decline at an alarming rate.

The graph above shows the number of farms operating in Canada in each of the Census years from 1911 to 2016.  Over the past 30 years—1986 to 2016—Canada lost one-third of its farm families.  A generation ago there were just under 300,000 farms in Canada; today there are just under 200,000.

The continuing loss of farms and farmers damages Canadian food security and food sovereignty, our capacity to produce local food, our ability to adapt to climate change, and our prospects for building environmentally sustainable food systems.  It also has negative effect on employment and rural economic development.

But there is another consideration, one that should interest every Canadian: the number of farms in Canada was reduced by one-third during a thirty-year period when taxpayer-funded transfers to farmers, in the form of farm-support programs, totaled more than 100 billion dollars.  (All figures are adjusted for inflation.)  The public policies and taxpayer dollars that Canadians understand as helping “save the family farm” are having no such effect.

This failure of farm-support programs to stabilize the number of farms can be traced to two factors.  First, such programs lack appropriate payment caps. Caps on total annual payments of $200,000 to $300,000 per farm could slow farm-size expansion and the attendant loss of farms.  But payments under AgriStability—Canada’s primary income stabilization and support program—are capped at $3 million per farm per year.

Second, our agricultural policies do nothing to challenge the pathology underlying the farm income crisis: wealth extraction by agribusiness.  As noted in a previous blog, over the past 30 years agribusiness has made off with 98 percent of farmers’ revenues.  From some perspectives, farm-support programs can be seen as fulfilling an enabling role: keeping farm families solvent so that powerful corporations can bleed off wealth.

This is not an argument against farm support payments—vital crop insurance and income-stabilization programs.  But it is a suggestion that farmers, citizens, and governments should all look critically at the real-world effects of these programs and the tens-of-billions of taxpayers’ dollars these programs consume.  All citizens have an interest in maximizing the number of farm families on the land.  By that measure, our agricultural policies and programs are failing miserably.  Canada’s family farms are disappearing.

Graph sources:  Statistics Canada, Census of Agriculture, various years; and F.H. Leacy, M.C. Urquhart, and K.A.H. Buckley, eds., Historical statistics of Canada (Ottawa: Statistics Canada and the Social Science Federation of Canada, 1983)

Far-flung food: local food falls victim to a fixation on food exports

A graph of Canadian agri-food exports and imports, 1970 to 2015
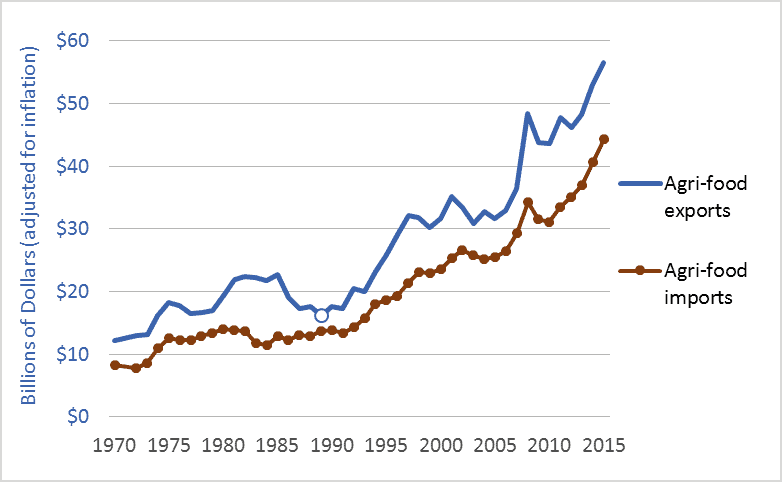
Canadian agri-food exports and imports, 1970 to 2015

The local food movement is important—a grassroots force for positive change.  People are increasingly aware of the benefits of eating local food and more are demanding it.  That said, it would be wrong to think that we are localizing our food system.  Just the opposite.  The most powerful players are putting their money and influence behind the project of globalizing and de-localizing our food supply.  Our food has never been less local.

In early-April, Canada’s federal government announced an ambitious new target for higher agri-food exports: $75 billion by 2025.  Unfortunately, as exports increase, so will imports.   We’re maximizing food miles.

The graph above shows Canadian agri-food exports and imports.  The units are billions of dollars, adjusted for inflation.  The graph covers 1970 to 2015.  A round circle highlights 1989, which marks the beginning of the modern “free trade” period.  In 1989, we implemented the historic Canada-US Free Trade Agreement (CUSTA).  Not long after, we implemented the North American Free Trade Agreement (NAFTA), and the World Trade Organization (WTO) Agreement on Agriculture.  Other agreements have followed.

Since ’89, Canada has been very successful in finding export markets for Canadian grains, meat, processed foods, and other agri-food products.  Exports have more than tripled.  This is no chance occurrence.  Governments and industry have worked together to drive up exports—repeatedly setting and meeting ever-higher targets.  In 1993, for example, federal and provincial governments pledged to double agri-food exports to $20 billion by 2000. Next, they pledged to double exports again: to $40 billion by 2005.  (This latter goal was actually suggested by the Canadian Agri-Food Marketing Council, an industry group that included representatives of Cargill, Maple Leaf, and McCains.)  Just last year, the Canadian Agri-Food Trade Alliance—whose members include some of the world’s largest agricultural traders and processors—voiced strong support for new trade agreements: the Comprehensive Economic and Trade Agreement (CETA) and the Trans-Pacific Partnership (TPP).  To support of this industry-led effort, the federal government has now pledged to help increase exports to $75 billion.  While many citizens want local food, governments and agribusiness appear to want the opposite.

The trade agreements that pave the way for Canadian exports do the same for imports.  Since 1989, Canadian food imports have more than tripled, to nearly $45 billion per year.  With each uptick in exports comes a comparable increase in imports.  If we reach our 2025 goal of $75 billion in exports, the trendlines in the graph above suggest that imports will rise to about $65 billion per year—on average, about $8,000 for a hypothetical family of four.  That’s a lot of imported food. Especially in a food-rich nation such as Canada.

The preceding is not an argument against exports and trade, or even against food imports.  But it is an argument against a simplistic fixation on exports.  While exports have doubled and redoubled, farmers’ net incomes have stagnated or fallen, the number of Canadian farms has been reduced by a third, farm debt has quadrupled, many Canadian processing companies have disappeared, and our agricultural and food systems have become increasingly controlled by foreign corporations.  Good agricultural policy must go far beyond a push to produce and export.  And a sound national food policy must go far, far beyond such simplistic schemes.

Graph sources: Agriculture and Agri-Food Canada (AAFC): “Agri-food Export Potential for the year 2000;” and data from AAFC by request.

Agribusiness takes all: 90 years of Canadian net farm income

Graph of Canadian net farm income and gross revenues, 1926 to 2016
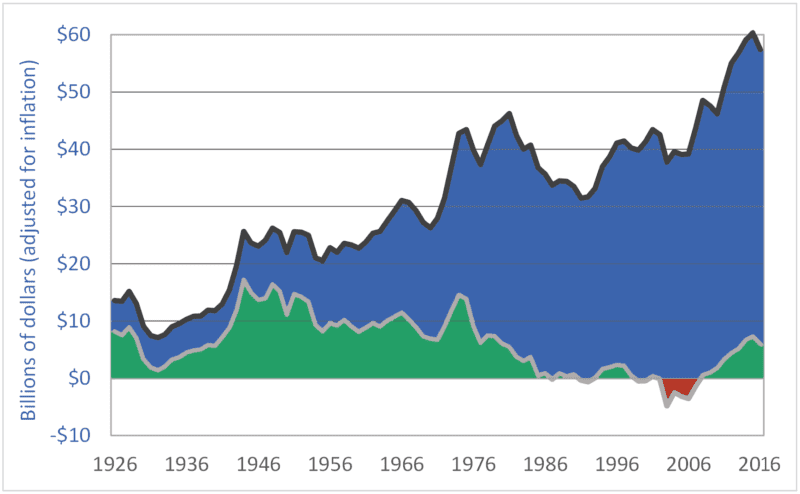
Canadian net farm income and gross revenue, inflation adjusted, net of government payments, 1926–2016.

Canadian net farm income remains low, despite a modest recovery during the past decade.  In the graph above, the black, upper line is gross farm revenue.  The lower, gray line is realized net farm income.  Both measures are adjusted for inflation.  And, in both cases, taxpayer-funded farm support payments are subtracted out, to remove the masking effects these payments can otherwise create.  The graph shows farmers’ revenues and net incomes from the markets.

The green-shaded area highlights periods of positive net farm income; the red-shaded area marks negative net income periods.  Most important, however, is the area shaded blue—the area between the gross revenue and net income lines.  That area represents farmers’ expenses: the amounts they pay to input manufacturers (Monsanto, Agrium, Deere, Shell, etc.) and service providers (banks, accountants, etc.).  Note how the blue area has expanded over time to consume almost all of farmers’ revenues, forcing Canadian net farm income lower and lower.

In the 23 years from 1985 to 2007, inclusive, the dominant agribusiness input suppliers and service providers captured 100 percent of Canadian farm revenues—100 percent!  During that period, all of farm families’ household incomes had to come from off-farm employment, taxpayer-funded farm-support programs, asset sales and depreciation, and borrowed money.  During that time, farmers produced and sold $870 billion worth of farm products, but expenses (i.e., amounts captured by input manufacturers and service providers) consumed the entire amount.

Bringing these calculations up to date, in the 32-year period from 1985 to 2016, inclusive, agribusiness corporations captured 98 percent of farmers’ revenues—$1.32 trillion out of $1.35 trillion in revenues.  These globally dominant transnational corporations have made themselves the primary beneficiaries of the vast food wealth produced on Canadian farms.  These companies have extracted almost all the value in the “value chain.”  They have left Canadian taxpayers to backfill farm incomes (approximately $100 billion have been transferred to farmers since 1985).  And they have left farmers to borrow the rest (farm debt is at a record high–just under $100 billion).  The massive extraction of wealth by some of the world’s most powerful corporations is the cause of an ongoing farm income crisis.

To leave a comment, click on the graph or this post’s title and then scroll down.

Graph sources: Statistics Canada, CANSIM matrices, and Statistics Canada, Agricultural Economic Statistics, Catalogue No.  21-603-XPE

Turning fossil fuels into fertilizer into food into us: Historic nitrogen fertilizer consumption

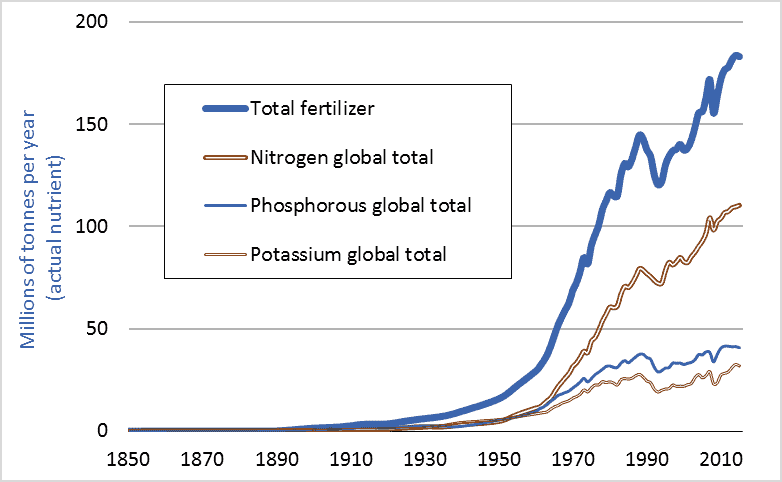
Graph of historic global fertilizer use, including nitrogen fertilizer, 1850-2015
Global consumption of nitrogen fertilizer and other fertilizers, historic, 1850 to 2015

Last week’s blog post (Feeding the World) showed that farmers worldwide had, since 1950, quadrupled grain production. How is this possible? The answer is fertilizer; more specifically, nitrogen fertilizer. This graph shows global fertilizer use. In 1950, farmers applied less than 5 million tonnes of nitrogen (measured in terms of actual nutrient, not fertilizer product). In 2015, farmers applied more than 110 million tonnes. We managed to increase grain output fourfold largely by increasing nitrogen inputs 23-fold.

Nitrogen fertilizer is a fossil fuel product, made primarily from natural gas. One can think of a modern nitrogen fertilizer factory as having a large natural gas pipeline feeding into one end and a large pipe coming out the other carrying ammonia, a nitrogen-rich gas. To produce, transport, and apply one tonne of nitrogen fertilizer requires an amount of energy equal to almost two tonnes of gasoline. One reason we have been able to increase grain production fourfold since 1950, and human population threefold, is that we found a way to turn fossil fuels into plant nutrients into enlarged food supplies into us. With fertilizers, we can convert hydrocarbons into carbohydrates.

Dr. Vaclav Smil is an expert on the material flows, nutrient cycles, and energy transformations that underpin natural and human systems. He believes that without the capacity to turn fossil fuels into nitrogen fertilizers into enlarged harvests, nearly half the 7.4 billion people now on Earth could not be fed and could not exist. Smil calls factory-made nitrogen “the solution to one of the key limiting factors on the growth of modern civilization.” This blog highlights the many ways humans have managed to remove the limiting factors to the growth of modern civilization.

Finally, 1950 was long ago. Surely rapid increases in fertilizer consumption must have tapered off in recent years. That isn’t the case. Canadian consumption is rising especially rapidly. A look at Statistics Canada data (CANSIM 001-0069) reveals that Canadian nitrogen fertilizer consumption has increased 65 percent over the past decade (2006 to 2016). Like many countries, Canada is boosting food output by increasing the use of energy-intensive agricultural inputs.

Graph sources: Vaclav Smil, Enriching the Earth; UN FAO, FAOSTAT; International Fertilizer Industry Association, IFADATA; and Clark Gellings and Kelly Parmenter, “Energy Efficiency in Fertilizer Production and Use.”

Feeding the world: our struggle to multiply global grain production

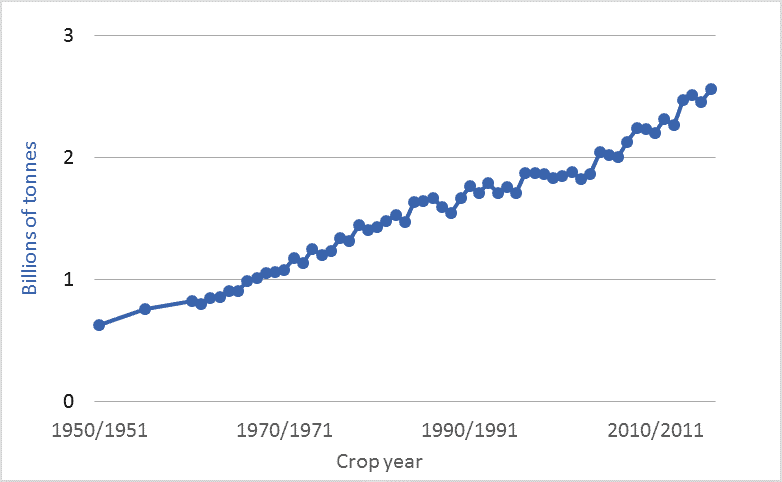
Graph of global grain production historic 1950 to 2016
Global grain production, annual, 1950–2016

This blog post and the next (Turning fossil fuels into … food) look at the rapid expansion of our global food supply and how we’ve accomplished that feat. The graph above shows world grain production for the past 66 years: 1950 to 2016. The units are billions of tonnes of annual production of all grains: primarily wheat, corn, rice, barley, oats, and millet. The figures exclude oilseeds, tonnage of which is about one-fifth as large as that of grains.

By utilizing ever-increasing inputs of water, machinery, fuels, chemicals, technologically-enhanced seeds, and, especially, fertilizers, the world’s farmers have managed to quadruple global grain production since 1950, and to double production since 1975. This expansion has been accomplished on a largely unchanged land area. Farmers have doubled output since the mid-’70s on a cropland area that, according to the UN’s Food and Agriculture Organization (FAO), has increased by just 5 percent.

The UN projects that global human population will increase by 50 percent by the end of this century, to 11.2 billion. That enlarged population will likely be richer, on average, than today’s population. Thus, per-capita meat demand will probably rise. When we feed grains to livestock, we turn 5 to 10 grain Calories into 1 meat Calorie. Thus, diets rich in meat require higher levels of grain production. Coming on top of these drivers of increased grain consumption is the likely increase in demand for biofuels, biomass, and feedstocks for “the bioeconomy.” The Global Harvest Initiative is an industry group whose members include John Deere, Monsanto, Mosaic, and Dupont. The group asserts that there is a “Global Agricultural Imperative” to “nearly double global agricultural output by 2050 to respond to a rapidly growing population and to meet the consumer demands of an expanding middle class.” If this doubling is accomplished, it will mark an 8-fold increase over 1950 production levels. Few citizens or policymakers are aware that the bounty in our supermarkets and on our tables depends upon very rapid and difficult-to-sustain rates of growth in food production.

Graph sources: 1960-2016: United States Department of Agriculture (USDA) World Agricultural Supply and Demand Estimates (WASDE),  ; 1950 and 1955: Lester Brown and Worldwatch Institute, various publications. Brown and Worldwatch cite USDA, “World Grain Database,” unpublished printout, 1991.