Saskatchewan’s new Climate Change Strategy: reckless endangerment

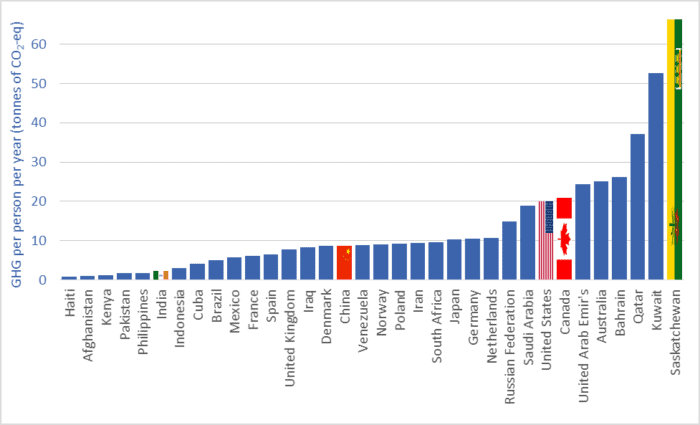
Graph of Saskatchewan greenhouse gas emissions relative to selected nations
Saskatchewan greenhouse gas emissions relative to selected nations

Saskatchewan’s greenhouse gas emissions are extremely high: 66 tonnes per person per year.  What if Saskatchewan was a country, instead of a province?  If that were the case, we’d find that no country on Earth had per-capita emissions higher than ours.

This week’s graph compares per-capita greenhouse gas (GHG) emissions in Saskatchewan to emissions in a variety of countries.  The units are tonnes of carbon dioxide equivalent (CO2-eq).  The data is for the years 2014 and 2015, the most recent years for which data is available.  The graph shows that Saskatchewan’s emissions are higher than those of petro-states such as Saudi Arabia and Qatar and manufacturing nations such as China and Germany.

Our world-topping per-person emissions form part of the context for this week’s release of the Government of Saskatchewan’s climate strategy: Prairie Resilience: A Made-in-Saskatchewan Climate Change Strategy.  The report isn’t really a plan of action—more an attempt at public relations and a collection of re-announcements.   Most critically, it lacks a specific set of measures that can, taken together, enable citizens and businesses in this province to reduce our GHG emissions by 30 percent by 2030.  I’ll review some of the key points of the document, but first just a bit more context.

In Paris in 2015, the world’s governments reaffirmed a target of limiting global temperature increases to 2 degrees Celsius (relative to pre-industrial levels).  However, more and more scientists are warning that 2 degrees is not a “safe level,” and that temperature increases of this magnitude will create floods, droughts, storms, and deaths in many parts of the world.  But a 2 degree rise is better than 4 or 5 degrees.

So that’s the first point: our 2 degree target is weak.  To this we’ve added inadequate emission-reduction commitments.  In the lead-up to the Paris climate talks the world’s governments each submitted specific emission-reduction commitments.  Canada committed to cut this country’s emissions by 30 percent (below 2005 levels) by 2030.  Other nations made similar pledges.  But here’s the troubling part: When you add up all those emissions-reduction commitments you find that they put the world on track, not for 2 degrees of warming, but for 3.2 degrees (UN Emissions Gap Report 2017).  So this is the context for recent climate change strategies from Saskatchewan and other provinces: These plans amount to inadequate provincial contributions to an inadequate national commitment to a weak international target.

One final bit of context: not only are per-capita emissions in Saskatchewan among the highest in the world, they continue to increase: up 65 percent in a generation (1990 to 2015).  Some will want to excuse our province: it’s cold here.  But our per-capita emissions are almost twice as high as those in the Northwest Territories, nine times as high as in the Yukon, and four times as high as those in neighbouring Manitoba.  Others will want to talk about the fact that Saskatchewan is a resource-producing and agricultural province; our prosperity depends upon our ability to keep farming and mining and producing oil and gas.  There’s a grain of truth to some parts of that idea, but it simply cannot be the case that “prosperity” requires the emission of 66 tonnes of GHGs per person.  Citizens in every nation want prosperity.  But if everyone in the world felt entitled to emit GHGs at the same rate as us, there would soon be no Saskatchewan as we know it.  There would be a parched desert here, and submerged cities worldwide.  In a climate- and carbon-constrained world, prosperity simply cannot require Saskatchewan-sized emissions.

So, with this for context, what does the Saskatchewan Climate Change Strategy propose?  The government has re-committed to increasing the production of low-emission electricity—to the “expansion of renewable energy sources up to 50 per cent of generating capacity” by 2030.  This is good news and we must ensure that this happens, well before 2030, if possible.  But careful readers might note three things in the preceding commitment:  1. the words “up to.”  2. generating capacity is not the same as output; because of the intermittent nature of wind power, for example, 50 percent of capacity will not equate to 50 percent of production.  3. electricity provides less than 30 percent of Saskatchewan’s total energy demand.  Thus, moving to 50 percent renewable/low-emission sources for electricity leaves 80+ percent of Saskatchewan’s energy needs filled by high-emission fossil fuels.

The Climate Change Strategy includes the creation of a technology fund.  But this is not new.  The government passed legislation in 2010 requiring large emitters to pay into a green technology fund.  That law was never put into force.

Predictably, the Strategy rejects a carbon tax, arguing that such a tax “would make it more difficult for our province to respond effectively to climate change because a simple tax will not result in the innovations required to actually reduce emissions.”

The Strategy also includes a vague mix of commitments to reporting, potential future measures to reduce methane emissions, emission-intensity targets, and offset trading.  Think of this as a cap-and-trade system without a cap.

The Strategy includes some positive steps but fails to deliver what we need: a comprehensive, detailed plan that will result in a 30 percent reduction in emissions by 2030.  This failing is especially evident when one takes into account probable emissions increases that may result from economic growth, planned increases in energy production, and increased use of agricultural inputs such as nitrogen fertilizer.  (Applied tonnage of N fertilizer has doubled since 2002.)

Overall, the Strategy steers away from discussions of emissions reduction and focuses instead on the idea of “resilience.”  That word appears 44 times in 12 pages.  The report defines resilience as “the ability to cope with, adapt to, and recover from stress and change.”  But resilience—coping, adapting, and recovering—may simply prove impossible in the face of the magnitude of climate change that will scorch our province under a business-as-usual scenario.  The high-emission, fossil-fuel-dependent future assumed in the Climate Change Strategy would raise the average temperature of this province by 6 to 8 degrees Celsius (sources available on request).  Climate disruption of that magnitude vetoes adaptation and mocks resilience.

And even if we in Saskatchewan could find ways to adapt and make ourselves resilient in the face of the blows that may be inflicted by a hotter, stormier, more damaging climate, we must ask: Will poor and vulnerable populations around the world be able to make themselves “resilient” to the climate change that our emissions trigger?   The global proliferation of Saskatchewan-level emissions would cause cities to disappear under the waves, food-growing regions to bake and wither, and tropical storms to become more numerous and damaging.  What is our ethical position if we are among the greatest contributors to these calamities, yet all we offer affected populations is the advice to make themselves more resilient?

A real plan is possible.  Emission reductions of 30 percent by 2030 are attainable at costs that Saskatchewan can afford.  Holding global temperature increases to 2 degrees also remains possible.  All this can be accomplished if governments act with courage and integrity, rapidly and effectively, and in the interests of citizens and the future.

Graph sources:
Saskatchewan and other provinces: Environment and Climate Change Canada, Canadian Environmental Sustainability Indicators: Greenhouse Gas Emissions.
Other nations: World Resources Institute, CAIT Climate Data Explorer.


Geoengineering: 12 things you need to know

Graphic showing various geoengineering methods

The following draws upon extensive research by ETC Group.  I have been privileged to serve on ETC’s Board of Directors for several years. 

1.  What is “geoengineering”?  It is the intentional, largescale, technological manipulation of Earth’s systems.  Geoengineering is usually discussed as a solution to climate change, but it could also be used to attempt to de-acidify oceans or fix ozone holes.  Here, I’ll concentrate on climate geoengineering.

2.  There are two main types of climate geoengineering:
i. Technologies to partially shade the sun in order to reduce warming (called “solar radiation management” or SRM).  For example, high-altitude aircraft could be used to dump thousands of tonnes of sulphur compounds into the stratosphere to form a reflective parasol over the Earth.
ii. Attempts to pull carbon dioxide (CO2) out of the air.  One proposal is ocean fertilization.  In theory, we could dump nutrients into the ocean to spur plankton/algae growth.  As the plankton multiply, they would take up atmospheric CO2 that has dissolved in the water.  When they die, they would sift down through the water column, taking the carbon to the ocean floor.

3.  The effects of geoengineering will be uneven and damaging.  For example, sun-blocking SRM technologies might lower the global average temperature, but regional temperature changes would probably be uneven.  Other geoengineering techniques—cloud whitening and weather modification—could similarly alter temperatures in some parts of the planet relative to others.  And if we change relative regional temperatures we would also shift wind and rainfall patterns.  Geoengineering will almost certainly cause droughts, storms, and floods.  Going further, however, all droughts, storms, and floods (even those that might have occurred in the absence of geoengineering) could come to be seen as caused by geoengineering and the governments controlling those climate interventions.  If we go down this path, there will no longer be any “acts of God”; weather will become a product of government.

4.  These technologies are dangerous in other ways.  Seeding the stratosphere with sulphur particles could catalyze ozone depletion.  Shifts in rain and temperature patterns may cause shifts in ecosystems and wildlife habitats.  Multiplying plankton biomass may affect fish species distribution and biodiversity.  Moreover, as with any enormously powerful technology, it is simply impossible to foresee the full range of unintended consequences.

5.  Geoengineering is unilateral, undemocratic, inequitable, and unjust.  In a geoengineered world, who will control the global thermostat?  Solar radiation management and similar schemes will inevitably be controlled by the dominant governments and corporations—a rich-nation “coalition of the dimming.”  But benefits and costs will be distributed unequally, creating winners and losers.  Where will less powerful nations appeal if they find themselves on the losing end?  Our climate interventions will be calibrated to maximize benefits to rich nations: the same countries that have benefited most from fossil fuel combustion and that have caused the climate crisis.  We appear to be contemplating a triple injustice: poor nations will be denied their fair share of the benefits of fossil fuel use; hit hardest by climate change; and left as collateral damage from geoengineering.  Finally, geoengineering is undemocratic in another way.  It is a choice to pursue technical interventions rather than social or political reforms.  It reveals that many governments and elites would risk damaging the stratosphere, hydrosphere, and biosphere rather than risk difficult conversations with voters, CEOs, or shareholders.

6.  Geoengineering embodies and proliferates a certain worldview: masculine, nature-dominating, imperialistic, managerial and technocratic, hostile to limits, and hubristic.

7.  Geoengineering will create conflicts.  Because technologies such as SRM are transboundary and have the potential to shift weather patterns they can lead to charges that other nations are stealing rain and, ultimately, food.  To get a sense of the potential for conflict, imagine the US reaction to unilateral deployment of weather- and climate-altering technologies by Russia or China.

8.  It is untestable.  Small-scale experiments with SRM or similar technologies will not reveal potential side-effects.  These will only become evident after planet-scale deployment, and perhaps years after the fact, as weather systems move toward new equilibria.

9.  Deployment may be irreversible.  Once we start we might not be able to stop.  Geoengineering would probably proceed alongside continued greenhouse gas (GHG) emissions.  But if we deploy sun-blocking technologies and simultaneously push atmospheric CO2 levels past 500 or 600 parts per million, we wouldn’t be able to terminate our dimming programs, no matter how damaging the effects of long-term geoengineering are revealed to be.  If we did stop, high GHG levels would trigger sudden and dramatic warming.  We risk locking ourselves into untestable, unpredictable, uncontrollable, and planet-altering technologies.

10. Can geoengineering “buy us time”?  Proponents argue that these technologies can buy us some time: time humanity needs in order to ramp up emissions reductions.  But geoengineering is more likely to buy time for the status quo, to prolong unsustainable fossil fuel production and energy inefficiency, and to blunt and delay urgent and effective action.  The effect of geoengineering is not so much to buy time as to waste time.

11. There will be attempts to pressure us into accepting geoengineering.  Geoengineering proponents may soon raise the alarm and claim that we must accept these risky technologies or face even worse damage from climate change.  “Desperate times call for desperate measures,”  they will say.  From these same sources may come arguments that geoengineering is necessary to hold global average temperature increases below 1.5 or 2 degrees and thus spare the world’s poorest and most vulnerable peoples.  Such arguments would be both ironic and duplicitous.  The same government and corporate leaders who today deny or downplay climate change, or deny the need for rapid action to cut emissions, may tomorrow be the ones raising the alarm, and claiming that there is no solution other than geoengineering.  They may pivot from claiming that there is no problem to claiming that there is no alternative.

12. Geoengineering will be pushed by the rich and powerful.  A growing number of corporations, elites, and politicians see the solution to climate change, not in emissions reduction, but in massive techno-interventions into the atmosphere or oceans to block the sun or suck up carbon.  When he was CEO of Exxon, US Secretary of State Rex Tillerson said of climate change: “It’s an engineering problem, and it has engineering solutions.”  Exxon employs many geoengineering proponents and theorists.  Former executive at oil company BP and former Under-Secretary for Science in the Obama administration Steven Koonin is lead author of a report entitled Climate Engineering Responses to Climate Emergencies.   Virgin Airlines CEO Richard Branson offered a $25 million prize to anyone who could solve climate change by geoengineering.   Bill Gates and other Microsoft billionaires are funding geoengineering research.  Newt Gingrich is the former speaker of the US House of Representatives and a Vice Chairman of Donald Trump’s transition team.  His views on geoengineering are worth quoting because they may be representative of a growing sentiment among political and corporate leaders.  Gingrich wrote in a 2008 fundraising letter:

“[T]he idea behind geoengineering is to release fine particles in or above the stratosphere that would then block a small fraction of the sunlight and thus reduce atmospheric temperature.

… Instead of imposing an estimated $1 trillion cost on the economy …, geoengineering holds forth the promise of addressing global warming concerns for just a few billion dollars a year.  Instead of penalizing ordinary Americans, we would have an option to address global warming by rewarding scientific innovation.

My colleagues at the American Enterprise Institute are taking a closer look at geoengineering, and we should too.  …

Our message should be: Bring on the American Ingenuity.  Stop the green pig.”


For reasons outlined above and many others, we must not go down the path of geoengineering.  These technologies—massive government and corporate interventions into the core flows and structures of the atmosphere, hydrosphere, and biosphere—are among the most dangerous initiatives ever devised.  Geoengineering must be banned; it is untestable, uncontrollable, unjust, probably irreversible, and potentially devastating.  There exist better, safer options: rapid and dramatic emissions reductions; and a government-led mobilization toward a transformation of global energy, transport, industrial, and food systems.


Carbon tax will not cause fossil fuel use to fall: Canada’s NEB

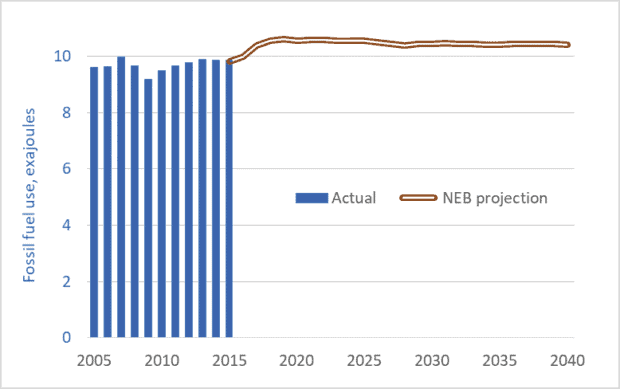
Graph of Canadian fossil fuel use and NEB projections to 2040
Canadian fossil fuel use, historic and projections to 2040

The graph above is based on data from a recent report by Canada’s National Energy Board (NEB)—a federal government agency.  The October 26 report, Canada’s Energy Future 2017, predicts that Canadians will be consuming fossil fuels at the same rate in 2040 as we are today.  The NEB is projecting that fossil fuel use will not fall, nor will attendant greenhouse gas (GHG) emissions.

The graph’s blue bars show Canadian fossil fuel use over the past 11 years.  The brown line shows the NEB’s projections for the future.  The units, exajoules, are not important.  What is important is that the NEB predicts no drop in fuel consumption.

Most important, is that the NEB’s projections take into account the federal government’s carbon tax.  Ottawa has announced that the provinces must impose a carbon tax of $10 per tonne in 2018, escalating to $50 per tonne by 2022.  All provinces must impose a tax, or some equivalent carbon-pricing scheme.

At the Paris climate talks in 2015, Canada joined other nations in committing to limit the global average temperature increase to 2.0 degrees C (relative to pre-industrial levels).  To help achieve that goal, Canada has made an international commitment to reduce its GHG emissions by 30 percent (relative to 2005 levels) by 2030.  The NEB is, in effect, saying that Canada will fail to meet its commitment of a 30 percent reduction; the carbon tax, along with all other measures announced so far, will not cause a decline in fossil fuel use or emissions.

The preceding should surprise no one.  The federal government’s carbon tax starts out at $10 per tonne of carbon—equivalent to about 2¢ per litre of gasoline.  Over the next half-decade, it rises to $50 per tonne—about 11¢ per litre.  Many Canadians do not know the price of gasoline to the nearest dime.  And gasoline prices over the past year were down as much as 40¢ compared to three years ago.  An 11¢ per litre carbon tax is not going to cause gasoline consumption to fall.  Similarly modest taxes on other fuels will likewise prove ineffective.

Canadians need to understand that they are being deceived.  Politicians—eager for re-election and afraid of hard conversations with voters—are understating the magnitude of the climate crisis and overestimating the effectiveness of our actions to counter the threat.

How do we actually reduce fossil fuel use, cut emissions, and stabilize the climate?  A carbon tax is needed, but it must be much higher: $200 to $300 per tonne—equivalent to 50¢ to 75¢ per litre of gasoline.  But such a tax is unbearable for citizens (and politicians) unless 100 percent of the total tax collected is rebated back to citizens on a per-capita basis.  We need a carbon-tax-and-refund system.  Under such a system, we would all pay taxes on gasoline, home heating fuel, etc. and pay indirectly on the energy embedded in our products.  Goods that required a lot of energy to produce or transport would cost more.  But offsetting these new costs, we would receive back all the carbon tax money collected, on a per-capita basis.  Thus, if a person’s energy consumption is below average, he or she would finish the year money ahead—his or her per-capita refund would exceed the carbon taxes paid.  On the other hand, someone who wants to drive a Hummer and heat and cool a huge home will come out money behind.  Another way of thinking about this tax-and-refund system is that it transfers money to those doing the right things from those doing the wrong things.  And the former group can take their carbon tax refunds and invest them in home energy retrofits, solar panels, and other emission-reduction measures, setting the stage for even larger carbon tax savings next year.

The NEB is telling us we’re not on track.  But we can change course.  Bold and rapid policy action now can reduce emissions by 30 percent and help limit temperature increases to 2 degrees.  But we must act.

Graph source: National Energy Board

Setting our future aflame: Projected energy use to 2035

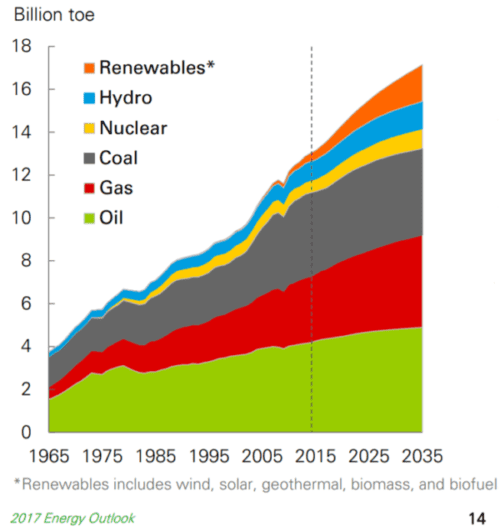
Graph of primary energy consumption by source or fuel, 1965 to 2015, with projections to 2035
Global primary energy use, by source or fuel, 1965 to 2015, with projections to 2035 (billions of tonnes of oil equivalent)

In a recent post (link here) I said that holding global temperature increases below dangerous levels would require “a mobilization of near-wartime scale and speed to transform the global economy and its energy and transportation systems.”  Most climate scientists looking at carbon budgets agree that global greenhouse gas emissions need to fall to near zero in the 2040s (to hold temperature increases below 1.5 degrees Celsius) or 2050s (to hold increases to 2 degrees).

So, how are we doing?  BP (formerly British Petroleum) is one of the world’s leading sources for energy statistics and projections.  This week’s graph is taken from the 2017 edition of its Energy Outlook.  The graph shows BP’s projections of energy use to 2035, based on current trends.  The picture is bleak.

BP’s projections show oil use/combustion rising over the next 18 years.  Natural gas combustion rises even faster.  Even coal combustion increases.  Not surprising, BP projects rising GHG emissions for the period from 2017 to 2035.  But this is exactly the time frame in which we are supposed to be rapidly reducing emissions.

If BP is correct, if we act in the ways they are predicting, there is zero chance of meeting the Paris commitments of reducing GHG emissions by 30 percent by 2030.  And there is zero chance of holding temperature increases below 2 degrees.  The picture BP paints, if we allow it to come to pass, would push global temperature increases past 3 degrees, or even higher.  That would be a cataclysmic amount of warming.

I’m told that fear and bad news are not good motivators.  But neither are delusion or denial.  We must stop telling ourselves fanciful stories about salvation by solar shingles.  The citizens of the world need to know the facts about our situation and our trajectory.  There is a vague feeling that we’re doing the right thing, that solar and wind power are growing so fast that we can meet our targets, that a modest carbon tax levied sometime in the future will be enough to put us onto the right track.  No.  Projections by BP and others tell a wholly different story.  The facts indicate that we are on track to climate calamity.  That may not be welcome news, but it is the truth.  Whether it motivates people remains to be seen.

Graph source: BP, Energy Outlook: 2017 edition

Everything must double: Economic growth to mid-century

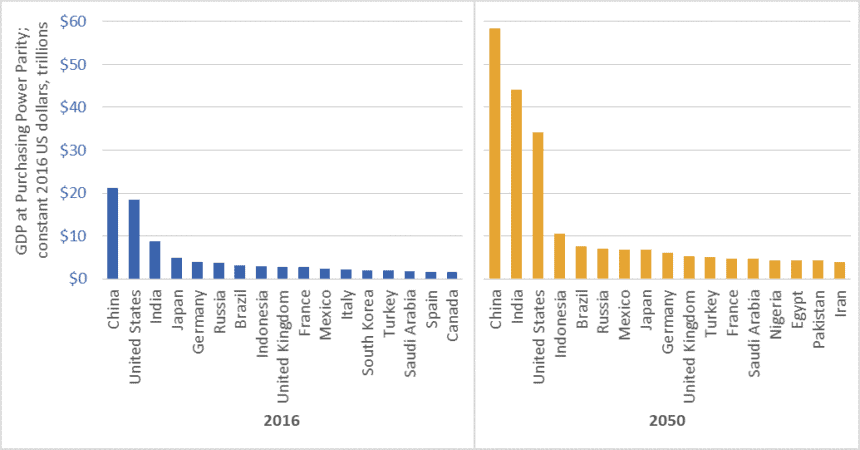
Graph of GDP of the world's largest economies, 2016 vs 2050
Size of the world’s 17 largest economies, 2016, and projections for 2050

In February 2017, global accounting firm PricewaterhouseCoopers (PwC) released a report on economic growth entitled The Long View: How will the Global Economic Order Change by 2050?  The graph above is based on data from that report.  (link here)  It shows the gross domestic product (GDP) of the largest economies in the world in 2016, and projections for 2050.  The values in the graph are stated in constant (i.e., inflation adjusted) 2016 dollars.

PwC projects that China’s economy in 2050 will be larger than the combined size of the five largest economies today—a list that includes China itself, but also the US, India, Japan, and Germany.

Moreover, the expanded 2050 economies of China and India together ($102.5 trillion in GDP) will be almost as large as today’s global economy ($107 trillion).

We must not, however, simply focus on economic growth “over there.”  The US economy will nearly double in size by 2050, and Americans will continue to enjoy per-capita GDP and consumption levels that are among the highest in the world.  The size of the Canadian economy is similarly projected to nearly double.   The same is true for several EU countries, Australia, and many other “rich” nations.

Everything must double

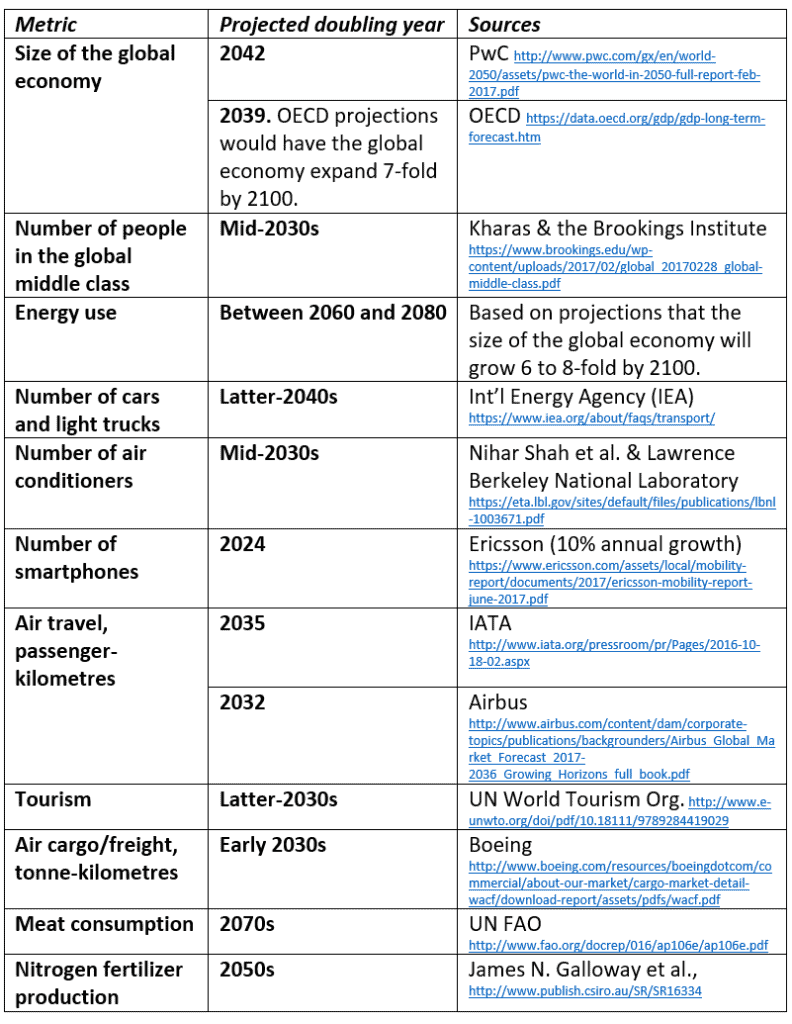
PwC’s report tells us that between now and 2050, the size of the global economy will more than double.  Other reports concur (See the OECD data here).  And this doubling of the size of the global economy is just one metric—just one aspect of the exponential growth around us.  Indeed, between now and the middle decades of this century, nearly everything is projected to double.  This table lists just a few examples.

Table of projected year of doubling for various energy, consumption, transport, and other metrics
Projected year of doubling for selected energy, consumption, and transport metrics

At least one thing, however, is supposed to fall to half

While we seem committed to doubling everything, the nations of the world have also made a commitment to cut greenhouse gas (GHG) emissions by half by the middle decades of this century.  In the lead-up to the 2015 Paris climate talks, Canada, the US, and many other nations committed to cut GHG emissions by 30 percent by 2030.  Nearly every climate scientist who has looked at carbon budgets agrees that we must cut emissions even faster.  To hold temperature increases below 2 degrees Celsius relative to pre-industrial levels, emissions must fall by half by about the 2040s, and to near-zero shortly after.

Is it rational to believe that we can double the number of cars, airline flights, air conditioners, and steak dinners and cut global GHG emissions by half?

To save the planet from climate chaos and to spare our civilization from ruin, we must—at least in the already-rich neighborhoods—end the doubling and redoubling of economic activity and consumption.  Economic growth of the magnitude projected by PwC, the OECD, and nearly every national government will make it impossible to cut emissions, curb temperature increases, and preserve advanced economies and stable societies.  As citizens of democracies, it is our responsibility to make informed, responsible choices.  We must choose policies that curb growth.

Graph source: PriceWaterhouseCoopers

Some good news on climate change

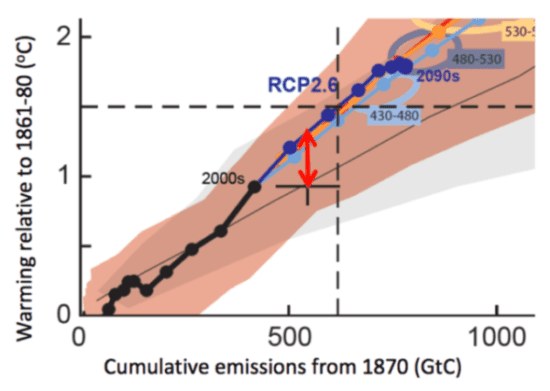
Graph adapted from Millar et al.
A graph produced by Millar et al. illustrating their re-assessment of carbon budgets.

A September 18th article in the journal Nature Geoscience provides some good news in the struggle to save human civilization (and perhaps half the planet’s species) from the ravages of climate change.  The article by Richard Millar and nine colleagues calculates that there is still time to hold global temperature rise to 1.5 degrees Celsius above pre-industrial temperatures.  (Article link is here.)

A 1.5 degree target was set in Paris in 2015.  While many people assert that holding temperature increases to 1.5 degrees is impossible, Millar et al. reassess carbon budgets to show that the target is attainable.  By their calculations, humans can emit an additional 700 to 900 billion tonnes of CO2 and still have a 66% chance of holding temperature increases below 1.5 degrees.  That amount of CO2 is approximately equal to 20 years of emissions at current rates.  (Previous assessments indicated that the carbon budget for 1.5 degrees would be used up in 5 to 7 years at current emission rates.)

The findings in the Millar paper are good news.  Here’s why: they take away the argument that “it’s too late.”  We still have it within our power to hold temperature increases below dangerous levels, spare low-lying island nations, prevent the inundation of rich river-delta agricultural lands in Bangladesh and elsewhere, retain the Greenland ice sheet, and prevent the worst ravages of climate change.  Here’s the message everyone should hear: It’s not too late.

But while it’s not too late, it is late.  The other message people should take from this article is that we have no time to spare.  Aggressive action is necessary now.  If we are to save ourselves from ourselves we must embark on a mobilization of near-wartime scale and speed to transform the global economy and its energy and transportation systems.  We need government-led mobilization for transformation.

The article’s lead author, Richard Millar, wrote a commentary stating that “the window for achieving 1.5C is still narrowly open.  If very aggressive mitigation scenarios can be implemented from today onwards, they may be sufficient to achieve the goals of the Paris Agreement.”  (Find that commentary here.)  At a press event he stated that holding increases to 1.5 degrees requires “starting reductions immediately and then reducing emissions to zero over 40 years.”  Like nearly everyone else who has looked at this issue, Millar and his team have concluded that emissions reductions must begin immediately and emissions from the global economy must be reduced to zero by the 2050s or 2060s.

So here’s where we are: Millar et al. calculate that we have the time (if only just).  We have the technologies: solar panels, wind turbines, electric trains, net-zero and passive solar homes.  We have historical examples of action on a similar scale: the WWII repurposing of the major industrial economies.  And we have the productive capacity: a global manufacturing sector of unprecedented scale and output.  Civilian and military aircraft makers must be compelled to immediately begin building trains.  Auto makers must build electric cars.  The home renovation industry must be redirected away from fantasy kitchens and home spas and toward energy-efficiency retrofits.  And electrical utilities must rapidly replace GHG-emitting generation plants with near-zero-emission alternatives.  And we must do all these things at rates that reflect that our future depends upon our success.

The calculations by Millar et al. are sure to be controversial and closely examined.  They may be revised.  But the paper has weight because the team that wrote it includes many of the leading experts on carbon budgets.  As climate scientist Glen Peter notes here: “the authors of this paper developed the idea of carbon budgets, are the world leading experts on carbon budgets, and derived the carbon budgets for the IPCC process.”  We should all hope that Millar and his colleagues are correct in their reassessment.

The graph above is taken from a commentary by Millar and adapted from the article by Millar et al.  (Link to the commentary here.)

China will save us?  50+ years of data on Chinese energy consumption

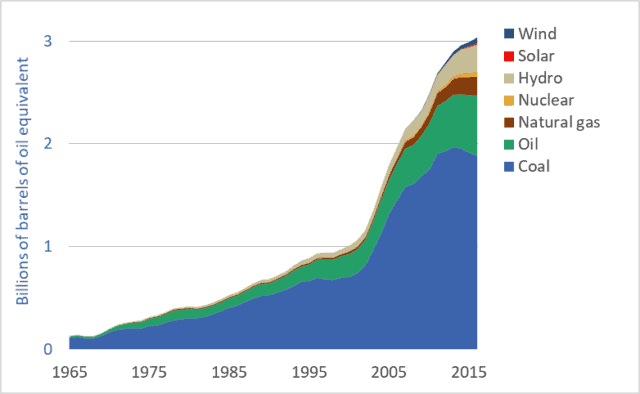
Graph of Chinese energy consumption by source or fuel, 1965 to 2016
Chinese energy consumption, by source or fuel, 1965 to 2016

There’s a lot being written about China’s rapid push to install solar panels and wind turbines (e.g., see here).  And as the US withdraws from the Paris Agreement, pundits have suggested that this opens the door for Chinese leadership on renewable energy and climate change mitigation (see here).  And China certainly has taken over global production of solar photovoltaic (PV) panels.  But is this talk of China’s low-carbon, renewable-energy future premature and overoptimistic?  Are we just pretending, because so little positive is happening where we live, that something good is happening somewhere?  Chinese energy consumption data provides a corrective to the flood of uncritical news stories that imply that China will save us.

This week’s graph shows how various energy sources are being combined to power China’s rapidly growing and industrializing economy.  The units are “billions of barrels of oil equivalent”: all energy sources have been recorded based on their energy content relative to the energy contained in a barrel of oil.  Similar data for Canada can be found here.  US data is coming soon.

Is the Chinese energy system being rapidly decarbonized?  Is China powered by wind turbines?  Or by coal?  The data can support some optimism for the future, but at present, most of the news is bad.  China remains the world’s largest consumer of fossil fuels and largest emitter of greenhouse gases (GHGs).  Let’s look at the good-news-bad-news story that is China’s energy system.

First, the good news: As is visible in the graph, China’s fossil fuel consumption has been flat-lined since 2013, and coal consumption is falling.  Further, CO2 emissions have been declining since 2014.  China has ceased, or at least paused, its rapid increase in its consumption of fossil fuels.

China is also leading the world in the installation of renewable energy systems, especially wind and solar generation systems (see here).  Chinese wind power production and consumption is growing exponentially—doubling approximately every two years.  Solar power production and consumption is growing even more rapidly and has increased 25-fold in just the past 5 years.  China has also invested massively in hydro dams, which can produce electricity with far fewer GHG emissions than coal-fired power plants.

But it would be naive or premature to simple project Chinese solar and wind power growth rates into the future and conclude that the nation will soon slash its emissions.  China’s coal-fired powerplants are relatively new and unlikely to be decommissioned prematurely.  No matter how cheap solar panels become, installing new solar arrays will never be cheaper than simply continuing to produce electricity with already-built coal plants.

Moreover, the graph makes clear that the current contribution of solar and wind to China’s energy system is small—about 2 percent of total consumption.  And while this portion will undoubtedly grow, there will be huge challenges for China as renewables make up a larger and larger percentage of its electricity generation capacity.  With a less-than-state-of-the-art power grid, China will face difficulties dealing with the fluctuations and uncertainty created by intermittent power sources such as wind and solar power.

Is China the leader we’re looking for?  If so, it is a very odd choice.  China has doubled its fossil fuel use and emissions since 2003.  It is the world’s largest fossil fuel consumer and GHG emitter, and these two facts will almost certainly remain true for decades to come.  The idea that China will pick up the slack as American and European commitments to decarbonization falter is dangerous wishful thinking.  Moreover, it should not be the case that we should expect China to lead.  It was us—the UK, US, EU, Canada and similar early-adopters of fossil fuels, cars, and consumerism—that overfilled the atmosphere with GHGs over the past century.  China has come late to the fossil fuel party.  Asking it to lead the way out the door—asking it to take the lead in decarbonization—is as inappropriate as it is naive.

Here’s one last reason why it’s wrong to look for China to lead the way to a zero-carbon future: Per person, China’s emissions are about half of those in Canada and the US (source here).  Is it right for those of us neck deep in high-emission consumerist car-culture to look to relatively poor people with relatively low emissions and urge them to “go first” down the road of carbon reduction?


Powering Canada: 51 years of Canadian energy use data

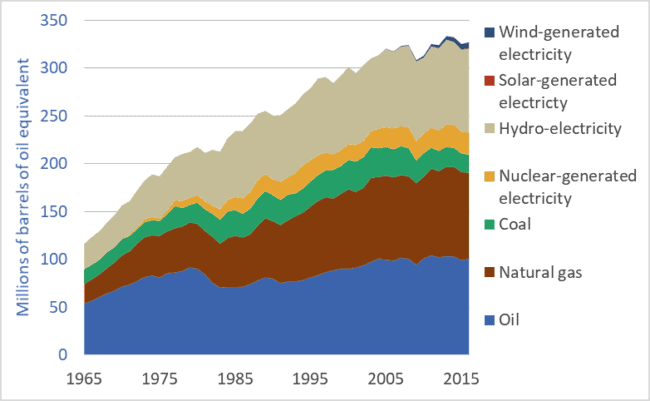
Graph of Canadian energy use, by fuel or energy source, 1965 to 2016.
Canadian energy use (primary energy consumption), by fuel or energy source, 1965 to 2016.

New reports in highly-respected journals Science and Nature (links here and here) tell us that the world’s economies and societies need to reduce carbon-dioxide emissions to zero before mid-century.  This has huge implications for the ways in which we power our cities, homes, food systems, transportation networks, and manufacturing plants.  Our civilization must undergo a rapid energy-system transformation, similar in magnitude and effects to previous energy transitions, such as the replacement of wood by fossil fuels in the 18th, 19th, and 20th centuries.  Enormous changes are on the way.

To understand our possible futures it is useful to know something of the past.  The graph above shows Canadian primary energy consumption from 1965 to 2016.  The units are “millions of barrels of oil equivalent”—that is, all energy sources have been quantified based on their energy content relative to the energy contained in a barrel of oil.  (“Primary energy” is energy in the form in which it is first produced: oil from a well, coal from a mine, hydroelectricity from a dam, or photovoltaic electricity from a solar panel.  Much of the coal and some of the natural gas listed in the graph above is turned into electricity in power generating stations.)

This multi-decade look at Canadian energy use reveals both good and bad news.  Most obvious, it shows that Canada has nearly tripled its overall energy consumption since 1965.  Today, on a per-capita basis, Canadians consume more energy than citizens of most other nations.  Our very high per-capita energy use will make our energy transition more difficult and costly.

On the positive side, our rate of increase in energy use is slowing—the top line of the graph is flattening out.  Partly, this indicates that Canadians are using energy more wisely and efficiently.  But another factor may be the transfer of heavy industry and manufacturing to other nations; Canadian energy use may be growing more slowly because more of our industrial and consumer goods are made overseas.  Also, the graph may not include the full extent of energy consumed in international shipping and aviation.  If Canada’s full share of global water and air transport were added, our energy use may appear higher still.

The graph has some good news in that fossil fuel use in Canada is declining.  Coal, oil, and natural gas provide less energy to our economy today than they did 20 years ago.  Coal use, especially, has been cut.  On the negative side, any downward trendline in fossil fuel use is not nearly steep enough to intersect zero by 2050.

Good news is that Canada already has a large number of low-emission energy sources in place.  We are the world’s third-largest producer of hydro-electricity.  We also produce significant amounts of electricity from nuclear powerplants.  Starting in the 1980s and continuing today, Canada has produced about a third of its primary energy from low-emission sources: including nuclear, hydro, wind, and solar electricity generation.

This brings us to perhaps the most important fact revealed by the graph: the very slow rate of installation of new low-emission energy sources—especially solar and wind.  Today, solar and wind provide just 2 percent of our primary energy.  Indeed, the contribution of solar power is barely visible in the graph.

An energy transformation is critical.  Global greenhouse gas emissions must peak before 2020 and ramp down sharply, reaching zero three decades later.  This will be, by far, the most rapid energy transition in human history.  Canadian action so far falls far short of the scale and rate required.

P.S. A new book on the history of Canadian energy systems has recently been published.  Powering up Canada: A History of Power, Fuel, and Energy from 1600 contains chapters on the energy sources for the fur trade, early horse-powered agriculture, the rise in the importance of coal in Canada, and chapter on the development of the oil and gas sectors.

Graph sources: BP Statistical Review of World Energy.


2016: record high fossil fuel use (!) and stagnating solar power installations (?)

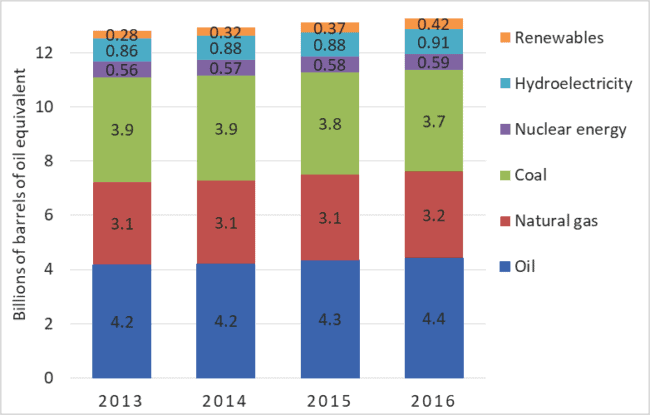
Graph of Primary energy consumption, by fuel or source, global, 2013-2016.
Primary energy consumption, by fuel or source, global, 2013-2016.

There are many kinds of climate change denial.  A minority of people deny that climate change is occurring or serious.  This is classic denial.  But a much more common and insidious form is all around us: accepting that the problem is real, but pretending that solutions are at hand, underway, or not very difficult.  By pretending that Elon Musk’s solar shingles or whiz-bang batteries can provide easy solutions, these people essentially deny the need for rapid, aggressive action.  They are wrong.  We are not solving the climate change problem.  At worst, record high rates of fossil fuel use are locking us into civilization-threatening levels of warming.  At best, we are proceeding toward solutions, but far too slowly.   What we must stop denying is the need for rapid, aggressive, transformative action.

Each year British Petroleum (BP) releases a report and dataset detailing global energy supply and demand.  The data includes each nation’s production and consumption of coal, oil, natural gas, hydroelectricity, and other energy sources.  Some data extends back to 1965.  BP provides one of the most important sources of energy information.  The company’s newest dataset—updated to include 2016—was released June 13th.  BP’s data shows that 2016 was another record-setting year for fossil fuel use: 11.4 billion tonnes of oil equivalent.  See graph above.  That same data shows that the rate of solar panel installation is slowing in nearly every nation.

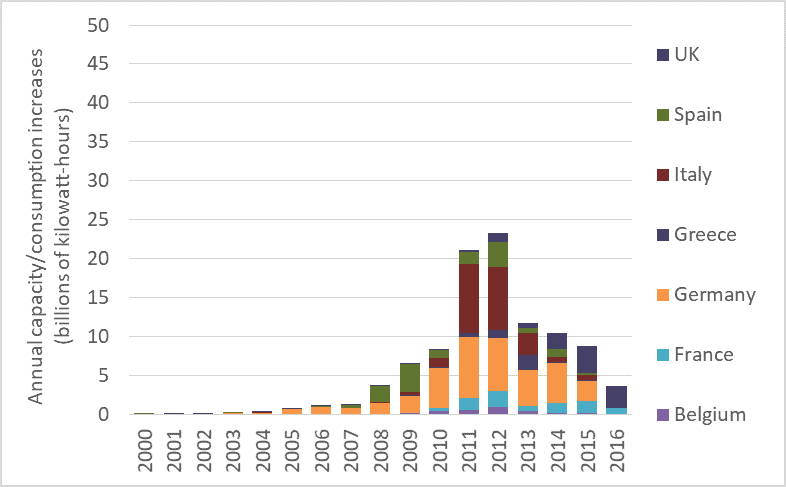
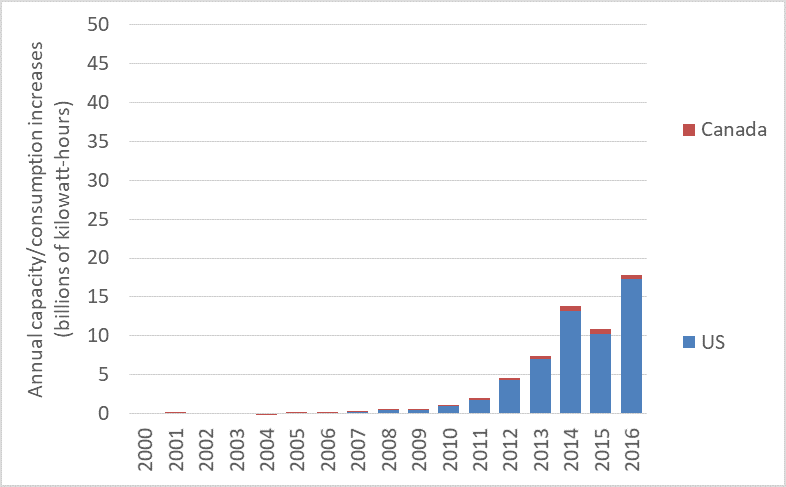
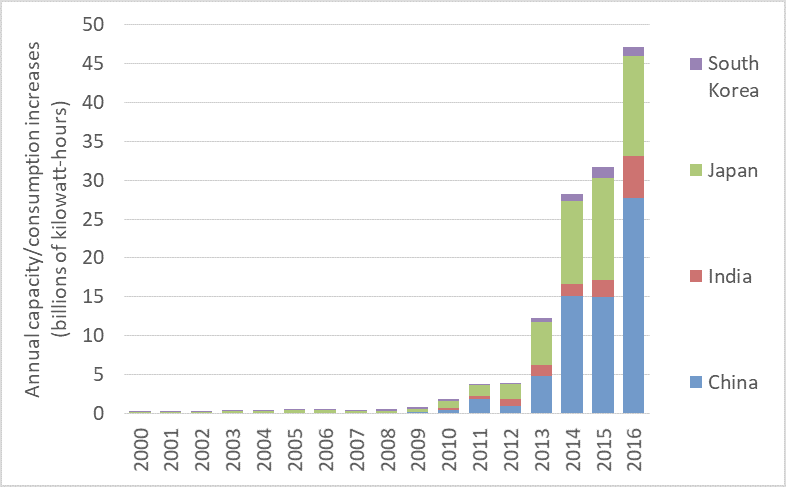
The three graphs below are also produced from recently-updated BP data.  They show the amount of annual increase in the production and use of solar PV electricity in various countries.  This is approximately equal to the annual amount of new capacity added, but it further takes into account how much of any new capacity is actually being utilized.  The North American, Asian, and European nations featured in the graphs together host 92 percent of the world’s installed solar generation capacity.

The first of the three graphs shows how much solar PV production/ consumption increased each year in selected EU countries over the past 17 years.  It’s bad news: the rate of additions to solar power consumption peaked in 2012 and has fallen dramatically since then.  The graph shows that the rate at which EU countries are installing solar panel arrays has collapsed since 2012.  Progress toward renewables is decelerating.

Annual PV production and consumption additions, 2000 to 2013, EU countries

Further, note how each individual country accelerated its installation then slowed.  Spain, represented by the green bars, ramped up installation of solar panel arrays in 2008 and ’09.  After that, solar PV additions to Spain’s grid fell sharply, and rallied in only one year: 2012.  Germany’s solar installations followed a similar trajectory.  In that country, annual increases in solar power production and consumption grew until 2011, then began falling.  Additions to solar power production and consumption in Italy peaked in 2011 and have been falling ever since.  Nearly every EU nation is slowing the rate at which they add solar power.

The next graph shows production/consumption additions in the US and Canada.  The rates of new additions in those countries also appears to be sputtering.

Annual-PV-production-and-consumption-additions-2000-to-2013-North-America

The final graph shows the rate of production/consumption increases in China, India, Japan, and South Korea.  Clearly, capacity and consumption are rising rapidly in Asia.  But note that rates of installation are increasing only in China and perhaps in India.  One EU-based analyst told me that in recent years China ramped up solar-panel production to serve markets in the EU and elsewhere.  But when demand in those markets contracted, faced with a glut of panels coming out of Chinese factories, the government there pushed to install those panels in China.  Perhaps that isn’t the entire story.  It may be that China’s world-leading solar install rates are partly caused by a visionary concern for the environment and the climate, and partly by the need to absorb the output of Chinese PV panel factories left with surpluses after other nations failed to maintain installation rates.

Annual-PV-production-and-consumption-additions-2000-to-2013-Asia

Together, these four graphs tell a disturbing story.  Instead of accelerating rates of solar panel installations, we see stagnation or decline in nearly every nation other than China.  This comes along-side record-high fossil fuel use and record-setting CO2 emissions.  We’re failing to act aggressively enough to decarbonize global electricity systems and we are largely ignoring the project of decarbonizing our overall energy systems.  Rather, we’re increasing carbon emissions.  And as we do so, we risk slamming shut any window we may have had to keep global temperature increases under 2 degrees C.

Graph sources: BP Statistical Review of World Energy.

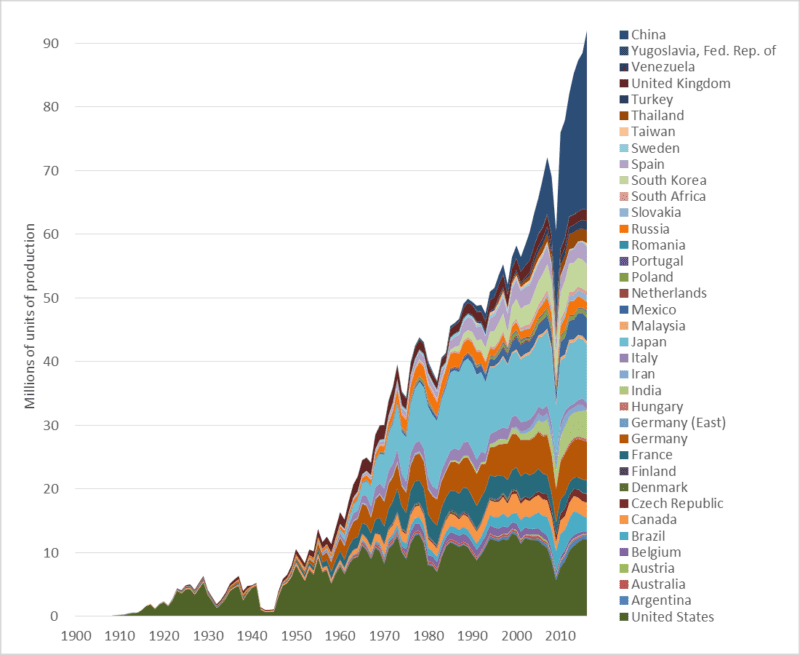
Happy motoring: Global automobile production 1900 to 2016

Graph of global automobile production numbers, various nations, historic, 1900 to 2016
Global automobile production (cars, trucks, and buses), 1900-2016

This week’s graph shows global automobile production over the past 116 years—since the industry’s inception.  The numbers include car, trucks, and buses.  The graph speaks for itself.  Nonetheless, a few observations may clarify our situation.

1.  Global automobile production is at a record high, increasing rapidly, and almost certain to rise far higher.

2. Annual production has nearly doubled since 1997—the year the world’s governments signed the Kyoto climate change agreement.

3. China is now the world’s largest automobile producer.  In terms of units made, Chinese production is double that of the United States.  This graph tells us something about the ascendancy of China.

4.  Most of the growth in the auto manufacturing sector is in Asia, especially Thailand, India, and China.  In 2000, those three nations together manufactured 3 million cars.  Last year their output totaled 34 million.  After 67 years of production, Australia is about to shut down its last automobile plant.  Most of its cars will be imported from Thailand, and perhaps a growing number  from China.

5. Auto production in “high-wage countries” is declining.  As noted, the Australian industry has been shuttered.  US production is down 5 percent since 2000, and Canadian production is down 20 percent.  Over that same period, production fell in France, Italy, and Japan, though not in Germany.  Since 2000, auto production increases in Mexico (+1.7 million) are roughly equal to decreases in Canada and the US (-1.2 million).

6. There are some surprises in the data:  Turkey, Slovakia, and Iran all make the  top-20 in terms of production numbers.

Graph sources: Motor Vehicle Manufacturers Association of the United States, World Motor Vehicle Data, 1981 Edition; Ward’s Communications, Ward’s World Motor Vehicle Data 2002; United States Department of Transportation, Bureau of Transportation Statistics, National Transportation Statistics, Table 1-23