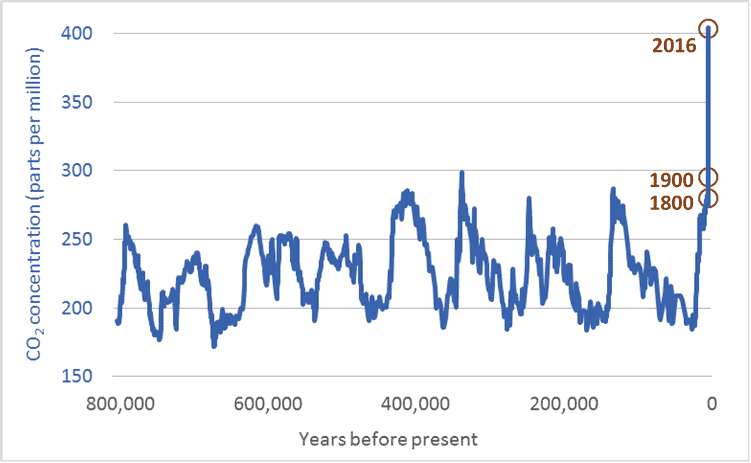
There are lots of graphs related to climate change. Only a few, however, get to the core of the issue. This is one such graph. It shows atmospheric carbon dioxide (CO2) levels over the past 800,000 years—a period four times longer than our species, Homo sapiens, has walked the Earth. The units, parts per million (ppm), will not be familiar to everyone. But the units aren’t important. What is important is the shape of the graph, and the magnitude of current CO2 levels relative to those in the past.
As the graph shows, over the past 800,000 years, atmospheric carbon dioxide levels have risen and fallen. Low concentrations correspond to ice ages—eight such periods are visible in the graph. Higher CO2 levels correspond to largely ice-free “interglacial” periods. The critical point is this: in the 800,000 years before the modern era, CO2 levels never once rose above 300 ppm. Not once. Now, however, CO2 levels are 405 ppm. And because our emissions continue, it is likely that atmospheric concentrations will increase past 500 ppm, maybe past 600 ppm. Temperature increases are lagging behind CO2 increases. As Earth’s temperatures rise to “catch up” with the rapid increase in CO2, it’s going to get very hot. And it is going to stay hot for a long time.
There can be no doubt: humans are the cause of the rapid rise in CO2 levels. No one can look at the graph above and come to any other conclusion. The years 1800 and 1900 are highlighted. The fossil-fuelled industrial and transportation revolutions of the 19th, 20th, and 21st centuries are clearly visible in the graph’s vertical spike—an increase in atmospheric CO2 that has proceeded further and faster than at any other time in the past 800,000 years.
CO2 levels have increased by 100 ppm in a century. The data shows that such an increase usually takes 10,000 years. Humans are causing CO2 levels to rise 100 times faster than those levels rose at any time in the past 800 millennia. Even worse, the rate of increase is accelerating; at current and projected emission rates, the next increase of 100 ppm may take just 40 to 60 years.
It is impossible to overstate the danger of what we are doing. Words cannot convey how damaging continued CO2-level increases will be to the long-term prospects for human cities, societies, and economies, or to other species and the natural ecosystems we all rely upon. It is as if we have decided to set fire to our home, the Earth. Unless we extinguish that fire, all we hold dear will perish. Currently, we are pouring on gasoline.
Note: CO2 measurements for recent decades come directly from air samples. Measurements for past centuries come from analysis of air trapped in bubbles in Antarctic ice. Each ice core is analyzed at multiple research facilities using multiple techniques. Because of this duplicate testing and diversity of sampling methods, there is high confidence among scientists that ice-core data accurately reflects CO2 levels in previous centuries.
Graph sources:
– 800,000 years ago to 1913: Ice core samples, Dome C, Antarctica (Monnin et al. 2001; Siegenthaler et al. 2005; Luethi et al.) and Vostok, Antarctica (Petit et al. 1999; Pepin et al. 2001; Raynaud et al. 2005)
– 1832 – 1978: Ice core samples, Law Dome, Antarctica
– 1959 – 2013: Direct atmospheric measurements, Mauna Loa Observatory, National Oceanic and Atmospheric Administration (NOAA)

