Electric car numbers, and projections to 2030

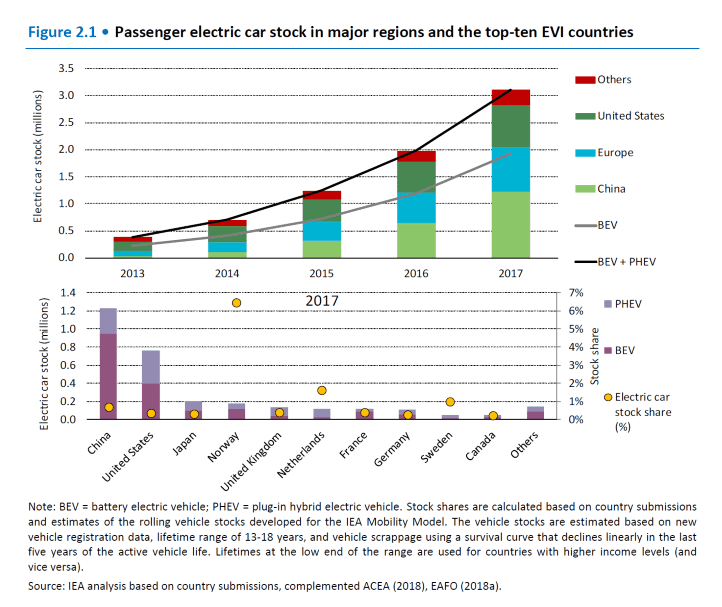
Graph of global electric vehicle numbers, 2013-17, and national data
Number of electric cars on the road, 2013 to 2017, and national data

In just two years, 2013 to 2015, the number of electric cars worldwide more than doubled.  And in the following two years, 2015 to 2017, the number more than doubled again, to just over 3 million.  This exponential growth means that electric vehicles (EVs)* will soon make up a large portion of the global car fleet.

This week’s graph is reprinted from Global EV Outlook 2018, the latest in a series of annual reports compiled by the International Energy Agency (IEA).

The graphs below show IEA projections of the number of EVs in the world by 2030 under two scenarios.  The first, the “New Policies Scenario,” takes into account existing and announced national policies.  Under this scenario, the number of EVs on the road is projected to reach 125 million by 2030.
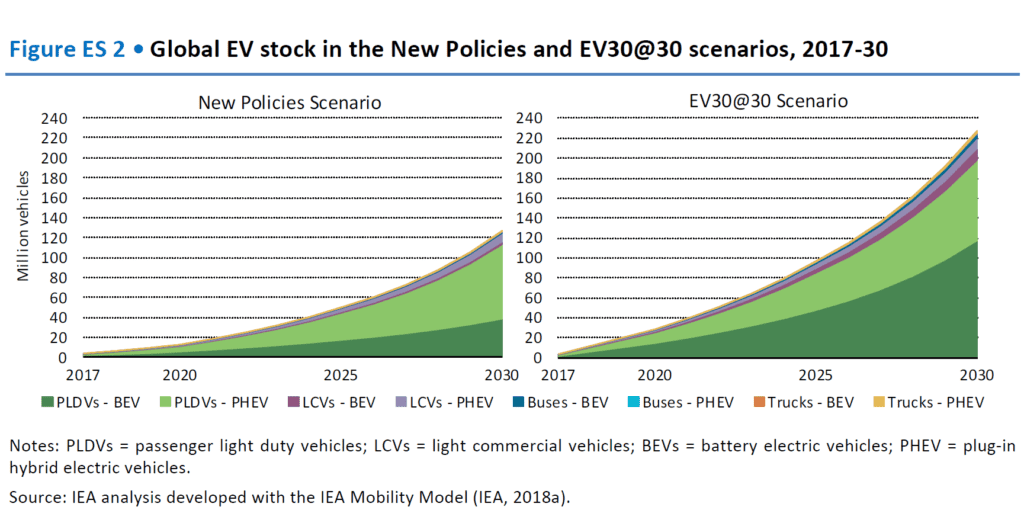
The second scenario is called “EV30@30.”  This scenario is based on the assumption that governments will announce and implement new policies that will increase global EV penetration to 30 percent of new car sales by 2030—a 30 percent sales share.  This 30 percent share is roughly what is needed to begin to meet emission-reduction commitments made in the lead-up to the 2015 Paris climate talks.  Under this scenario, the number of EVs on the road could reach 228 million by 2030.

In either case, whether there are 125 million EV’s on the road in twelve years or 228 million, the result will be an impressive one, given that there were fewer than a million just four years ago.

Electric cars are not a panacea, but they do represent an important transition technology; electrifying much of the global car fleet can buy us the time we need to build zero-emission train and transit systems.  Thus, it is very important that we move very rapidly to maximize the number of EVs built and sold.  But the IEA is clear: EV adoption will depend on ambitious, effective government action.  The 228 million EVs projected under the EV30@30 Scenario will only exist if governments implement a suite of aggressive new policies.  The IEA states that:

“The uptake of electric vehicles is still largely driven by the policy environment.  The ten leading countries in electric vehicle adoption all have a range of policies in place to promote the uptake of electric cars.  Effective policy measures have proved instrumental in making electric vehicles more appealing to customers…, reducing risks for investors, and encouraging manufacturers to scale up production ….  Key examples of instruments employed by local and national governments to support EV deployment include public procurement programmes…, financial incentives to facilitate the acquisition of EVs and cut their usage cost (e.g. by offering free parking), and a variety of regulatory measures at different administrative levels, such as fuel-economy standards and restrictions on the circulation of vehicles based on tailpipe emissions performance.”

In 2018, about 95 million passenger cars and commercial vehicles were sold worldwide.  About 1 million were electric—about 1 percent.  The goal is to get to 30 percent in 12 years.  Attaining that goal, and thereby averting some of the worst effects of climate change, will require Herculean efforts by policymakers, regulators, international bodies, and automakers.

* There are two main types of EVs.  The first is plug-in hybrid electric vehicles (PHEVs).  These cars have batteries, can be plugged in, and can be driven a limited distance (usually tens of kilometres) using electrical power only, after which a conventional piston engine engages to charge the batteries or assist in propulsion.  Examples of PHEVs include the Chevrolet Volt and Toyota Prius Prime.  The second type is the battery electric vehicle (BEV).  BEVs have larger batteries, longer all-electric range (150 to 400 kms), and no internal combustion engines.  Examples of BEVs include the Chevrolet Bolt, Nissan Leaf, and several models from Tesla.  The term “electric vehicle” (EV) encompasses both PHEVs and BEVs.


$100 billion and rising: Canadian farm debt

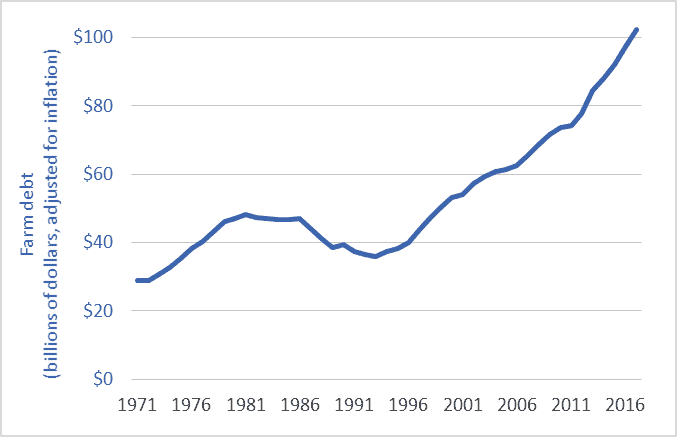
Graph of Canadian farm debt, 1971-2017
Canadian farm debt, 1971-2017

Canadian farm debt has risen past the $100 billion mark.  According to recently released Statistics Canada data, farm debt in 2017 was $102.3 billion—nearly double the level in 2000.  (All figures and comparisons adjusted for inflation.)

Some analysts and government officials characterize the period since 2007 as “better times” for farmers.  But during that period (2007-2017, inclusive) total farm debt increased by $37 billion—rising by more than $3 billion per year.

Here’s how Canadian agriculture has functioned during the first 18 years of the twenty-first century (2000 to 2017, inclusive):

1. Overall, farmers earned, on average, $47 billion per year in gross revenues from the markets (these are gross receipts from selling crops, livestock, vegetables, honey, maple syrup, and other products).

2. After paying expenses, on average, farmers were left with $1.6 billion per year in realized net farm income from the markets (excluding farm-support program payments).  If that amount was divided equally among Canada’s 193,492 farms, each would get about $8,300.

3. To help make ends meet, Canadian taxpayers transferred to farmers $3.1 billion per year via farm-support-program payments.

4. On top of this, farmers borrowed $2.7 billion per year in additional debt.

5. Farm family members worked at off-farm jobs to earn most of the household income needed to support their families (for data see here and here).

The numbers above give rise to several observations:

A. The amount of money that farmers pay each year in interest to banks and other lenders ($3 billion, on average) is approximately equal to the amount that Canadian citizens each year pay to farmers ($3.1 billion).  Thus, one could say that, in effect, taxpayers are paying farmers’ interest bills.  Governments are facilitating the transfer of tax dollars from Canadian families to farmers and on to banks and their shareholders.

B. Canadian farmers probably could not service their $100 billion dollar debt without government/taxpayer funding.

C. To take a different perspective: each year farmers take on additional debt ($2.7 billion, on average) approximately equal to the amount they are required to pay in interest to banks ($3 billion on average). One could say that for two decades banks have been loaning farmers the money needed to pay the interest on farmers’ tens-of-billions of dollars in farm debt.

Over and above the difficulty in paying the interest, is the difficulty in repaying the principle.  Farm debt now—$102 billion—is equal to approximately 64 years of farmers’ realized net farm income from the markets.  To repay the current debt, Canadian farm families would have to hand over to banks and other lenders every dime of net farm income from the markets from now until 2082.

The Canadian farm sector has many strengths.  By many measures, the sector is extremely successful and productive.  Over the past generation, farmers have managed to nearly double the value of their output and triple the value of agri-food exports.  Output per year, per farmer, and per acre are all up dramatically.  And Canadian farmers lead the world in adopting high-tech production systems.  The problem is not that our farms are backward, inefficient, or unproductive.  Rather, the problems detailed above are the result of voracious wealth extraction by the dominant agribusiness transnationals and banks. (To examine the extent of that wealth extraction, see my blog post here).

Although our farm sector has many strengths and is setting production records, the sector remains in a crisis that began in the mid-1980s.  And what began as a farm income crisis has metastasized into a farm debt crisis.  Further, the sector also faces a generational crisis (the number of farmers under the age of 35 has been cut by half since 2001) and a looming climate crisis.  Policy makers must work with farmers to rapidly restructure and transform Canadian agriculture.  A failure to do so will mean further costs to taxpayers, the destruction of the family farm, and irreparable damage to Canada’s food-production system.