Deep into the red: US national debt per family, 1816 to 2016

US national debt graph 1816 to 2016, dollars per family
United States national debt, per family of four, 1816-2016

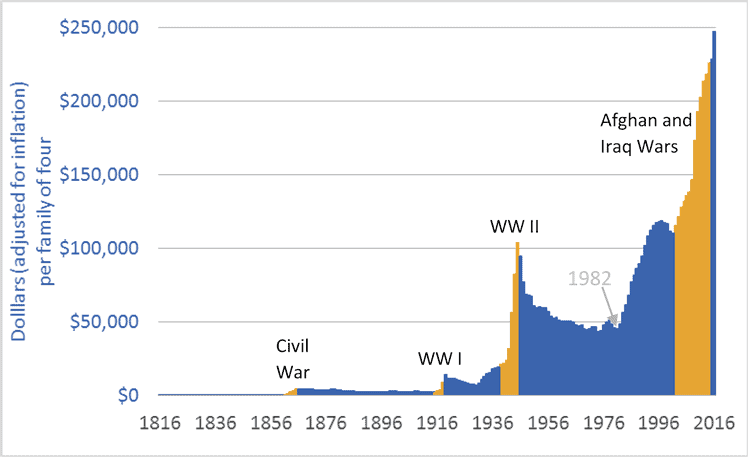
In the United States, federal government debt is nearly $20 trillion. That works out to about $62,000 per person, or just under $250,000 for a hypothetical family of four. Adjusted for inflation, debt has doubled since 2002, and is five times higher than in 1982.

The graph above shows the increasing size of the US national debt. The time-frame is 1816 to 2016. The units are US dollars, adjusted for inflation. In the graph, some conflict periods are highlighted in a contrasting colour. Wars have caused rapid increases in government debt. Indeed, the wars in Iraq and Afghanistan (2002-2014) played significant roles in creating the unprecedented level of debt US families now must carry. Other factors include a financial meltdown and bailout, and tax cuts that eroded revenues and forced governments to fund a greater portion of their services with borrowed money. As visible in the graph, 1982 marks the beginning of the recent phase of debt expansion. That is also the beginning of the modern era of tax cutting—the implementation of the Reagan tax cuts. US citizens have enjoyed tax cuts, but have yet to pay for them.

The graph shows that periods of increasing national debt (the Civil War, WW I, and WW II) were followed by periods of declining debt. The question now is this: Does the US economy retain enough vigour, and do US citizens and businesses retain enough good sense and discipline, to pay down $20 trillion in federal government debt, trillions more in personal debt, and trillions more in city, county, and state debts? It is never wise to bet against America. But de-industrialization, rising income inequality, world-leading incarceration rates, uncontrolled gun crime, Detroit and similar rustbelt cities, legislative gridlock, crumbling infrastructure, and a retreat into ideology all raise serious concerns.

For comparison, Canadian national debt works out to about $80,000 (Cdn.) per hypothetical family of four. Canadians, however, must not feel in any way superior or safe, because the Canadian and US economies are so tightly tied. Rising US debt is a concern for all the world’s citizens.

Graph sources: U.S. Department of the Treasury, “TreasuryDirect: Historical Debt Outstanding–Annual” 

This isn’t normal: 2,000 years of economic growth

Graph of gross world product (GWP) historic, for the past two thousand years
Gross World Product (GWP) over the long term, 1 CE – 2015 CE

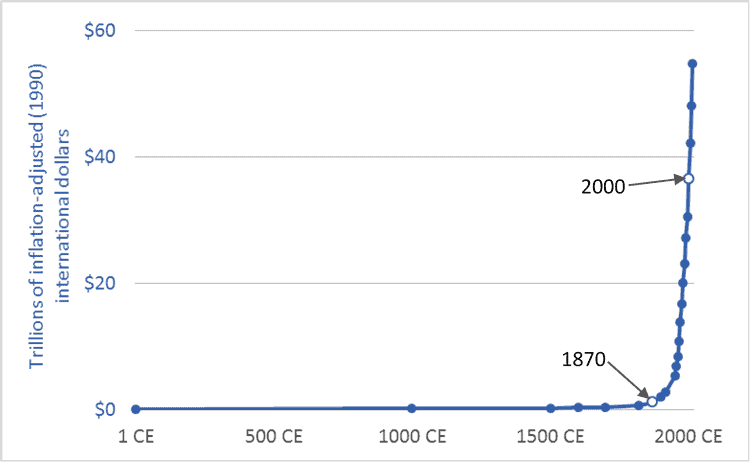
The graph above places our 21st century global economy in its long-term context. It plots Gross World Product (GWP), the global aggregation of Gross Domestic Product (GDP). The time frame is the past 2,015 years: 1 CE (or AD) to 2015 CE. The units are trillions of US/international dollars adjusted for inflation (converted to 1990 dollars). The main source is Angus Maddison.  Pre-20th century values are, by necessity, informed estimates by Maddison.

The year 1870 is marked with a white circle. In the millennia before 1870, the size of the global economy barely grew at all. Then, not long before the eve of the 20th century, all Hell broke loose. The most recent ten or fifteen decades appear in our historical economic record like an explosion. For perhaps 98 percent of human history, the economic trendline has been almost flat—horizontal. Over the past century-and-a-half it has been almost vertical.

The late-19th, 20th, and early 21st centuries have not been “normal.” They have been extraordinary and wondrous. Equally extraordinary is how far we have gone to normalize what is clearly an abnormal situation. Though our lifestyles and expectations are now tightly bound to near-vertical trendlines we talk and act as if nothing out of the ordinary is happening, and that we can count on more of the same for the foreseeable future.

Moreover, the 20th and 21st century exceptionalism on display in this graph is not limited to economic growth. Graphs of energy use, population, cotton or iron production, water withdrawals, food production, automobile numbers, air-travel miles, and nearly any other economic metric will look nearly identical to the graph above: millennia of little or no growth, then a sudden spike. There is upon the Earth a wholly new kind of civilization.

Graph sources: Angus Maddison, The World Economy, vol. 2, Historical Statistics (Paris: OECD, 2006) Tables 7b and 8b; and World Bank, “World DataBank: World Development Indicators: GDP at market prices” 

Exponential growth: US and Canadian GDP in the 20th century

US and Canadian Gross Domestic Product (GDP) historic
Canada and US Gross Domestic Product (GDP), 1900–2016

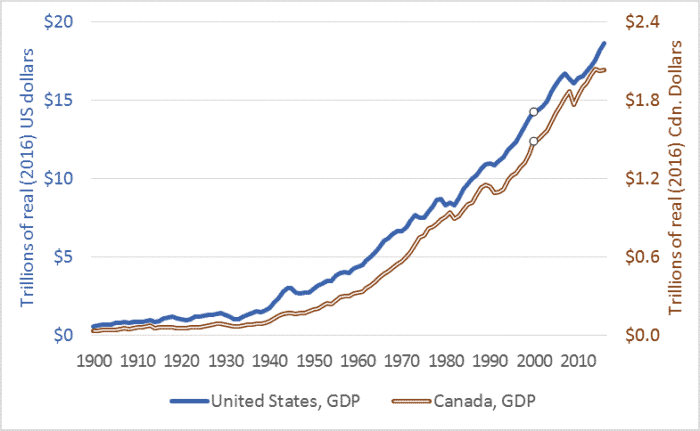
This graph shows the increasing sizes of the US and Canadian economies. The graph plots US Gross Domestic Product (GDP) on the left-hand axis, and Canadian GDP on the right. The time-frame is 1900 to 2016. The year 2000 is marked with an open circle, to highlight the 20th century. The units are trillions of US or Canadian dollars, and all figures are adjusted for inflation, that is, they are stated in 2016 dollars.

How much did these economies grow during the 20th century? US GDP in 1900 was $0.59 trillion dollars (in today’s US currency). In 2000, GDP was $14.3 trillion dollars—24 times larger. Canada’s economy in 2000 was 45 times larger than in 1900.

We can calculate the average annual growth rate. During the 20th century, the US economy grew at an average compound rate of 3.2 percent. We often hear growth rates of 2 to 3 percent described as normal. Indeed, if rates in the US or comparable nations fall below 2 percent, analysts warn of “slow growth.” Moreover, in recent years there has been consternation as Chinese economic growth rates have fallen from 9 or 10 percent per year to 7.

Can the US and comparable economies grow at rates in the 21st century that were “normal” in the 20th? Even if annual growth slows to an average of just 2 percent, the size of the US economy will increase 7-fold between 2000 and 2100. If the US economy grows at 2 percent per year throughout the 21st century, by 2100 the US economy alone will be more than twice as large as the global economy of 2000.

Growth rates of 2 or 3 percent per year, modest when considered over the short term, will, over several decades, cause an economy to double and redouble in size. Can we multiply the sizes of already-large national economies five- or ten-fold this century? Is it wise to try?

Graph sources: United States GDP: US Deptartment of Commerce, Bureau of Economic Analysis, NIPA Table 1.1.5; and Louis Johnston and Samuel Williamson, “What Was the U.S. GDP Then?” MeasuringWorth, https://www.measuringworth.com/usgdp/ . Canadian GDP: Statistics Canada CANSIM Tables 380-0566 and 384-0037; and M.C. Urquhart, “New Estimates of Gross National Product, Canada, 1870-1926…,” in Long-Term Factors in American Economic Growth, eds. Stanley Engerman and Robert Gallman (Chicago: University of Chicago Press, 1986)