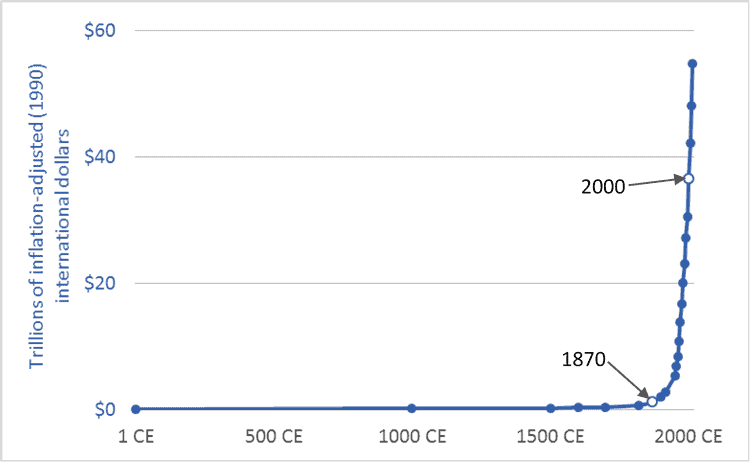
The graph plots historic Gross World Product (GWP) for the past two-thousand-plus years. It shows the long period of slow or no growth, and the recent spike.

Author, civilizational critic, long-term thinker, researcher, speaker
The graph plots historic Gross World Product (GWP) for the past two-thousand-plus years. It shows the long period of slow or no growth, and the recent spike.