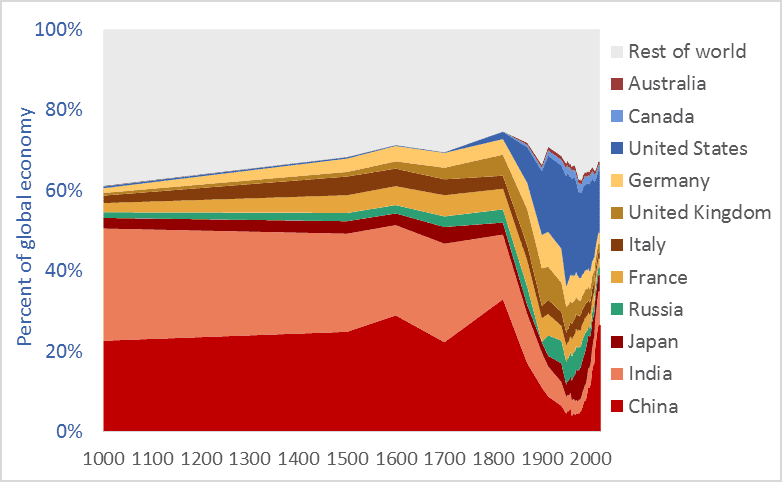
China’s share of the global economy has increased rapidly—from about 5 percent in the early 1980s to more than 26 percent today. India’s economy has similarly expanded, from 3 percent of the global economy in the early ’80s to more than 8 percent today. Meanwhile, the percentage shares of the US, UK, Germany, Japan, and other nations are falling fast. The graph above shows the relative share of global GDP represented by selected nations. The time-frame is 1000 AD to 2016.
Manufacturing data* similarly shows India and China’s long-term dominance. In 1800, fully half the manufacturing output of the world came from India and China. In that year, the UK contributed 4.3 percent of manufacturing output and the US just 0.8 percent. The UK and US came to dominate global manufacturing by the late-1800s, but their rise is recent and, as the graph above suggests, their dominance may be shortlived.
Many people have been surprised by the “rise of China” and that of India. No one should be. The global economy is merely returning to its long-term normal—resetting after an anomalous period when European and New World nations were economically ascendant. Indeed, England and Europe have been economic backwaters for 97 percent of the time since civilizations first arose 5,000 years ago. Our educational system fails to teach us that China and India are the default global superpowers.
To give just two final examples of the long-term dominance of Asia, China smelted hundreds of thousands of tons of iron in the 11th century using coal rather than wood, a feat not matched in Europe until 600 years later.** A list of the ten largest cities in the world in the year 1500 includes four in China (Beijing, Nanjing, Hangzhou, and Guangzhou) and two in India (Gaur and Vijayanagara), but just one in Europe, (Paris). The three cities rounding off the top-ten list were Tabriz, Cairo, and Istanbul.*** Clearly, the economic and civilizational centre of gravity was in the East. It appears to be shifting back there.
* Paul Bairoch, “International Industrial Levels from 1750 to 1980”
** Hartwell, various pubs
*** Hohenberg, Oxford Encyclopaedia of Economic History
Graph sources: 1000AD-2008, Angus Maddison, 2009-2016 Conference Board

