Greta vs. growth

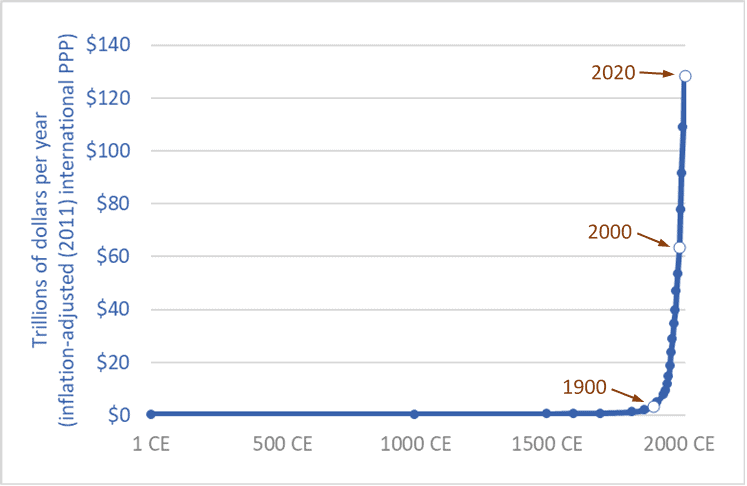
Graph of the size of the global economy (Gross World Product) historic
The size of the global economy (Gross World Product) over the long term, 1 CE – 2020 CE

“People are suffering.  People are dying.  Entire ecosystems are collapsing.  We are in the beginning of a mass extinction, and all you can talk about is money and fairy tales of eternal economic growth.  How dare you!”  So spake Greta Thunberg at the United Nations on September 23rd, 2019.

Thunberg, a sixteen-year-old without a university education, has had the insight, clarity, and courage to say what ten-billion-dollars worth of Ph.D. economists haven’t: that continued economic growth is, at best, unsustainable and probably much worse: a malignant illusion driving us to destroy our biosphere, civilization, and future.  The project of making the current global economy four or eight times larger is a suicide pact.

The graph above places our 21st century economy in its long-term context.  It shows the size of the global economy (Gross World Product) from 1 CE to 2020.  The units are trillions of US/international dollars adjusted for inflation (constant 2011 dollars).  The main source is the World Bank, with historical data from Angus Maddison.  (Pre-20th century values are, by necessity, estimates by Maddison.)

The years 1900, 2000, and 2020 are highlighted.  Sometime in 2020 the size of the global economy will surpass 127 trillion dollars.  When it does, it will be twice as large as it was in 2000.  The economy will have doubled in size in just 20 years.  This shouldn’t be a surprise.  Sustained growth rates of 3.5 percent leads to a doubling every 20 years.  (Recall the Rule of 70.)

Going forward, if we maintain current rates of growth—three to four percent annually—the economy will be twice as large again by 2040 or soon after—making it four times larger than in 2000.  Earth’s atmosphere, oceans, land, and biosphere will be hosting four 2000-sized economies.

And by 2060 or 2070, another doubling will bring the global economy to eight times its 2000 level.  And there’ll still be more than enough time left in this century to double it again—at least a 16-fold increase in size in a single century, if we stay the course.  If we accomplish this, we will be reprising the 18-fold increase seen during the 20th century.

Of course, we won’t do this—we won’t make the global economy 8 or 16 times larger.  Within a generation or two nearly everyone on the planet will be living in a post-growth economy: either because we’ve had the wisdom to end runaway exponential growth and put the biosphere first, or because we have not.

The end of growth, inescapable in the medium term, will bring numerous problems, such as how will we deal with the equity claims of the poor if we can no longer rely on the convenient fictions of “a rising tide raises all boats” and “anyone (everyone?) can grow up to be rich.”  While the end of growth must come for nearly all within a few decades, it must come first for those of us who are richest, so that growth can continue in places where people are poorer.  Those of us who enjoy jet vacations need to step off the growth escalator first so that growth can continue for others and deliver to them running water and refrigerators.  The end of growth casts into sharp relief a series of moral problems.

But the end of growth will also solve many problems.  We will be forced to take less of our economy’s productivity and bounty in the form of consumer products and more in the form of free time and low-emission leisure—more time with family, more time with friends drinking coffee or wine, more time with culture and nature; more discussion, poetry, romance, literature, and contemplation.  Most of the people in the fast-expanding (-metasticizing?) global middle class are living high-stress, low-quality, time-impoverished lives.  Stepping off the growth escalator can be part of a larger civilizational, cultural, and spiritual shift in which we rediscover meaning and purpose beyond getting and spending.

Thunberg is neither sage nor prophet.  And one need be neither to see what is absolutely, inescapably obvious: growth must and will soon end.  But we have a choice: We can deny the fact of growth’s imminent end and continue in the fairy tale and massively deplete and damage the planet in a last frenzied attempt to squeeze out one or two more doublings, or we can be as mature as a sixteen-year-old, admit the obvious, get on with the needed changes, and reap the benefits of slower, saner, more sustainable, more enjoyable lives.

Sources for graph:
– 
World Bank, Databank website: “GDP, PPP (constant 2011 international $)”
– 
Angus Maddison, The World Economy, Volume 1: A Millennial Perspective (Paris: OECD, 2001); Angus Maddison, Contours of the World Economy, 1–2030 AD: Essays in Macro-Economic History (Oxford: Oxford University Press, 2007)



A critically important solution to our climate crisis (and other crises)

Reconstructed wreckage of TWA Flight 800
US National Transportation Safety Board (NTSB) reconstruction of wreckage from TWA Flight 800

Ronald Wright’s A Short History of Progress is available as a book and as a five-part audio series—the 2004 CBC Massey Lectures.  (Listen here.)  In both its written and oral forms, A Short History of Progress is an accessible, eye-opening tour of humanity’s long historic journey—a look at the big picture and the long term.  It is aphoristic and packed with insights.  But one idea stands out.  Wright gets at this important idea by using the analogy of plane crashes.

Air travel today is very safe.  Mile for mile, your chances of being killed or injured while traveling on a commercial jetliner are about one one-hundredth your chances of suffering the same fate in your own car.  In 2016, zero people died in crashes of a US-based airlines operating anywhere in the world—the seventh year in a row that this was true (source here).

There’s a reason that airliners have become so safe: after every crash, well-resourced teams of highly-trained aviation experts are tasked with determining why a crash occurred, and once the cause is known the entire global aviation system implements changes to ensure that no plane in the future crashes for the same reasons.

Government agencies and airlines often expend enormous efforts to determine the cause of a crash.  The photograph above is of the reconstructed wreckage of TWA Flight 800, a Boeing 747 that crashed in 1996 after its fuel tank exploded, splitting the plane apart just ahead of the wings.  The plane crashed into the ocean off the coast of New York.  All 230 people aboard died.

The debris field covered several square miles.  In a massive effort, approximately 95 percent of the plane’s wreckage was salvaged from the sea.  The plane was painstakingly reconstructed.  And using the reconstructed plane as well as the flight data and cockpit voice recorders, the cause of the failure was traced back to a short circuit in wiring connected to the “fuel quantity indication system” in the centre fuel tank.  As a result of this investigation, changes were made to planes around the world to ensure that no similar crashes would occur.  As a result of crash investigations around the world, airlines and aircraft makers have made thousands of changes to airplane construction, crew training, air traffic control, airport security, airline maintenance, and operating procedures.  The results, as noted above, have been so successful that some years now pass without, for instance, a single fatality on a US airline.

Ronald Wright argues that the ruins and records of fallen civilizations can be investigated like airplane crash sites, and we can use the lessons we learn to make changes that can safeguard our current global civilization against similar crashes.  He writes that these ruined cities and civilizations are like “fallen airliners whose black boxes can tell us what went wrong” so that we can “avoid repeating past mistakes of flight plan, crew selection, and design.”  When Wright talks metaphorically about “flight plan,” consider our own plan to increase the size of the global economy tenfold, or more, this century.  And when he talks about crew selection, think about who’s in the cockpit in the United States.

Wright continues: “While the facts of each case [of civilizational collapse] differ, the patterns are alarmingly … similar.  We should be alarmed by the predictability of our mistakes but encouraged that this very fact makes them useful for understanding what we face today.”

Wright urges us to deploy our archaeologists, historians, anthropologists, ecologists, and other experts as crash-scene investigators—to read “the flight recorders in the wreckage of crashed civilizations,” and to take what we learn there and make changes to our own.  It is good advice.  It is, perhaps, the best advice our global mega-civilization will ever receive. 

While the crash of a jetliner may kill hundreds, the crash of our mega-civilization could kill billions.  And as more passengers pile in, as our global craft accelerates, and as the reading on the fuel-gauge drops and our temperature gauge rises, we should become more and more concerned about how we will keep our civilizational jetliner aloft through the storms to come.

Photo source: Newsday 

Everything must double: Economic growth to mid-century

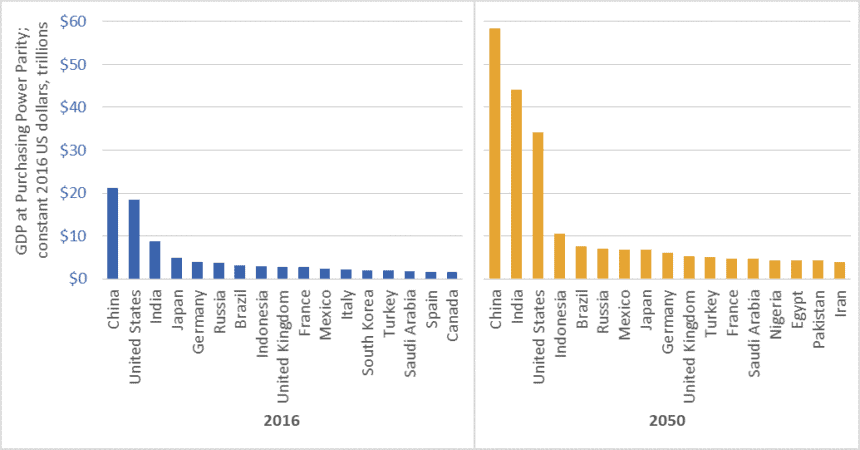
Graph of GDP of the world's largest economies, 2016 vs 2050
Size of the world’s 17 largest economies, 2016, and projections for 2050

In February 2017, global accounting firm PricewaterhouseCoopers (PwC) released a report on economic growth entitled The Long View: How will the Global Economic Order Change by 2050?  The graph above is based on data from that report.  (link here)  It shows the gross domestic product (GDP) of the largest economies in the world in 2016, and projections for 2050.  The values in the graph are stated in constant (i.e., inflation adjusted) 2016 dollars.

PwC projects that China’s economy in 2050 will be larger than the combined size of the five largest economies today—a list that includes China itself, but also the US, India, Japan, and Germany.

Moreover, the expanded 2050 economies of China and India together ($102.5 trillion in GDP) will be almost as large as today’s global economy ($107 trillion).

We must not, however, simply focus on economic growth “over there.”  The US economy will nearly double in size by 2050, and Americans will continue to enjoy per-capita GDP and consumption levels that are among the highest in the world.  The size of the Canadian economy is similarly projected to nearly double.   The same is true for several EU countries, Australia, and many other “rich” nations.

Everything must double

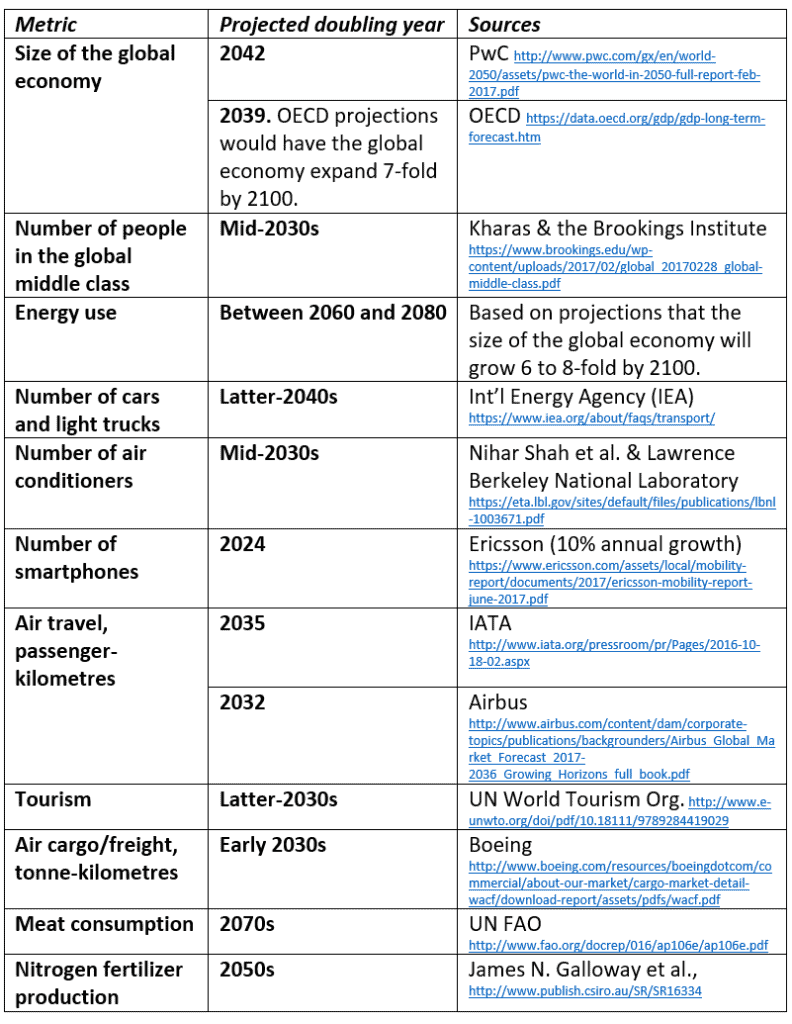
PwC’s report tells us that between now and 2050, the size of the global economy will more than double.  Other reports concur (See the OECD data here).  And this doubling of the size of the global economy is just one metric—just one aspect of the exponential growth around us.  Indeed, between now and the middle decades of this century, nearly everything is projected to double.  This table lists just a few examples.

Table of projected year of doubling for various energy, consumption, transport, and other metrics
Projected year of doubling for selected energy, consumption, and transport metrics

At least one thing, however, is supposed to fall to half

While we seem committed to doubling everything, the nations of the world have also made a commitment to cut greenhouse gas (GHG) emissions by half by the middle decades of this century.  In the lead-up to the 2015 Paris climate talks, Canada, the US, and many other nations committed to cut GHG emissions by 30 percent by 2030.  Nearly every climate scientist who has looked at carbon budgets agrees that we must cut emissions even faster.  To hold temperature increases below 2 degrees Celsius relative to pre-industrial levels, emissions must fall by half by about the 2040s, and to near-zero shortly after.

Is it rational to believe that we can double the number of cars, airline flights, air conditioners, and steak dinners and cut global GHG emissions by half?

To save the planet from climate chaos and to spare our civilization from ruin, we must—at least in the already-rich neighborhoods—end the doubling and redoubling of economic activity and consumption.  Economic growth of the magnitude projected by PwC, the OECD, and nearly every national government will make it impossible to cut emissions, curb temperature increases, and preserve advanced economies and stable societies.  As citizens of democracies, it is our responsibility to make informed, responsible choices.  We must choose policies that curb growth.

Graph source: PriceWaterhouseCoopers

Full-world economics and the destructive power of capital: Codfish catch data 1850 to 2000

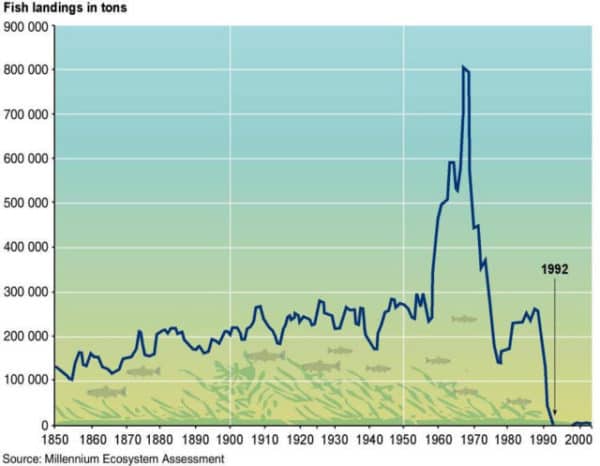
Graph of North Atlantic cod fishery, fish landing in tonnes, 1850 to 2000
Codfish catch, North Atlantic, tonnes per year

Increasingly, the ideas of economists guide the actions of our elected leaders and shape the societies and communities in which we live.  This means that incorrect or outdated economic theories can result in damaging policy errors.  So we should be concerned to learn that economics has failed to take into account a key transition: from a world relatively empty of humans and their capital equipment to one now relatively full.

A small minority of economists do understand that we have made an important shift.  In the 1990s, Herman Daly and others developed the idea that we have shifted to “full-world economies.”  (See pages 29-40 here.)  The North Atlantic cod fishery illustrates this transition.  This week’s graph shows tonnes of codfish landed per year, from 1850 to 2000.

Fifty years ago, when empty-world economics still held, the fishery was constrained by a lack of human capital: boats, motors, and nets.  At that time, adding more human capital could have caused the catch to increase.  Indeed, that is exactly what happened in the 1960s when new and bigger boats with advanced radar and sonar systems were deployed to the Grand Banks and elsewhere.  The catch tripled.  The spike in fish landings is clearly visible in the graph above.

But in the 1970s and ’80s, a shift occurred: human capital stocks—those fleets of powerful, sonar-equipped trawlers—expanded so much that the limiting factor became natural capital: the supply of fish.  The fishery began to collapse and no amount of added human capital could reverse the decline.  The system had transitioned from one constrained by human capital to one constrained by natural capital—from empty-world to full-world economics.  A similar transition is now evident almost everywhere.

An important change has occurred.  Unfortunately, economics has not internalized or adapted to this change.  Economists, governments, and business-people still act as if the shortage is in human-made capital.  Thus, we continue our drive to amass capital—we expand our factories, technologies, fuel flows, pools of finance capital, and the size of our corporations, in order to further expand the quantity and potency of human-made capital stocks.  Indeed, this is a defining feature of our economies: the endless drive to expand and accumulate supplies of capital.  That is why our system is called “capitalism.”  And a focus on human-made capital was rational when it was in short supply.  But now, in most parts of the world, human capital is too plentiful and powerful and and, thus, destructive.  It is nature and natural capital that is now scarce and limiting.  This requires an economic and civilizational shift: away from a focus on amassing human capital and toward a focus on protecting and maximizing natural capital: forests, soils, water, fish, biodiversity, wild animal populations, a stable climate, and intact ecosystems.  Failure to make that shift will push more and more of the systems upon which humans depend toward a collapse that mirrors that of the cod stock.

Graph source:  United Nations GRID-Arendal, “Collapse of Atlantic cod stocks off the East Coast of Newfoundland in 1992


Complexity, energy, and the fate of our civilization

Tainter Collapse of Complex Societies book cover

Some concepts stay with you your whole life and shape the way you see the world.  For me, one such concept is complexity.  Thinking about the increasing complexity of our human-made systems gives a window into future energy needs, the rise and fall of economies, the structures of cities, and possibly even the fate of our global mega-civilization.

In 1988, Joseph Tainter wrote a groundbreaking book on complexity and civilizations: The Collapse of Complex Societies.  The book is a detailed historical and anthropological examination of the Roman, Mayan, Chacoan, and other civilizations.  As a whole, the book can be challenging.  But most of the important big-picture concepts are contained in chapters 4 and 6.

Regarding complexity, energy, and collapse, Tainter argues that:

1.  Human societies are problem-solving entities;
2.  Problem solving creates complexity: new hierarchies and control structures; increased reporting and information processing; more managers, accountants, and consultants;
3.  All human systems require energy, and increased complexity must be supported by increased energy use;
4.  Investment in problem-solving complexity reaches a point of declining marginal returns: (energy) costs rise faster than (social or economic) benefits; and
5.  Complexity rises to a point where available energy supplies become inadequate to support it and, in that state, an otherwise withstandable shock can cause a society to collapse.  For example, the western Roman Empire, unable to access enough bullion, grain, and other resources to support the complexity of its cities, armies, and far-flung holdings, succumbed to a series of otherwise unremarkable attacks by barbarians.

Societies certainly are problem-solving entities.  Our communities and nations encounter problems: external enemies, environmental threats, resource availability, disease, crime.  For these problems we create solutions: standing armies and advanced weaponry, environmental protection agencies, transnational energy and mining corporations, healthcare companies, police forces.

Problem-solving, however, entails costs in the form of complexity.  To solve problems we create ever-larger bureaucracies, new financial products, larger data processing networks, and a vast range of regulations, institutions, interconnections, structures, programs, products, and technologies.  We often solve problems by creating new managerial or bureaucratic roles (e.g., ombudsmen, human resources managers, or cyber-security specialist); creating new institutions (the UN or EU); or developing new technologies (smartphones, smart bombs, geoengineering, in vitro fertilization).  We accept or even demand this added complexity because we believe that there are benefits to solving problems.  And there certainly are, at least if we evaluate benefits on a case-by-case basis.  Taken as whole, however, the unrelenting accretion of complexity weighs on the system, bogs it down, increases energy requirements, and, as Tainter argues, eventually outstrips available energy supplies and sets the stage for collapse.  We should keep this in mind as we push to further increase the complexity of our civilization even as energy availability may be contracting.  Tainter is telling us that complexity has costs—costs that civilizations sometimes cannot bear.  This warning should ring in our ears as we consider the internet of things, smart-grids, globe-circling production chains, and satellite-controlled autonomous cars.  The costs of complexity must be paid in the currency of energy.

Complexity remains a powerful concept for understanding our civilization and its future even if we don’t share Tainter’s conclusion that increasing complexity sets the stage for collapse.  Because embedded in Tainter’s theory is an indisputable idea: greater complexity must be supported by larger energy inflows.  Because of their complexity, there simply cannot be low-energy versions of London, Japan, the EU, or the global trading system.  As economies grow and consumer choices proliferate and as we increase the complexity of societies here and around the world we necessarily increase energy requirements.

It is no longer possible to understand the world by watching money flows.  There are simply too many trillions of notional dollars, euros, and yen flitting through the global economy.  These torrents of e-money obscure what is really happening.  If we want to understand our civilization and its future, we must think about energy and material flows—about the physical structure and organization of our societies.  Complexity is a powerful analytical concept that enables us to do this.

Fractal collapse: How the dominant societies and economies may fail.

Six images showing the stages of formation of a Sierpinski triangle
The stages of formation of a Sierpinski triangle illustrating fractal collapse

Fractal collapse is an important, useful idea.  It helps us understand that a society, economy, political system, or civilization may not “fall,” but rather become pock-marked and weakened—shot through with micro-collapses.

The United States may be in an advanced state of collapse.  There are many indicators that this is the case.  The national debt, nearly $20 trillion, about a quarter-million dollars per family of four (see my “US national debt per family”), seems unrepayable.  America’s former industrial heartland is now mostly rustbelt, and parts of Detroit look like sets for “Walking Dead” or “The Road.”  Climate change is bearing down from one side and resource depletion from another.  Its democratic system—rotted by dark money, voter suppression, gerrymandering, the distortions of the Electoral College, and messianic populist politics—has delivered gridlock, ideologues, cartoon-level analyses of complex issues, and, now, Trump.  Many of the manufacturing jobs that have not moved to Asia may soon be taken by robots.  Inequality and incarceration-rates are at record highs.  One could extend this list to fill pages.

Despite the preceding, I’m not predicting that America (or Greece or Australia or England) will “fall”—pitch into rapid and irreversible economic contraction and social disintegration.  Instead, fractal collapse is more likely.  In fractal collapse, parts of a system fail, at various scales, but the system, in diminished form, carries on.  We’re seeing this in America.  We see the collapse of a household here (perhaps a result of the opioid crisis), and a neighbourhood, there; a city declines rapidly (think Detroit or Scranton) and a county declares bankruptcy.  Collapse occurs in various places and at various scales but the aggregate entity moves forward.  And such collapses are not predictable—they do not just happen to poor people or in the “poor” places.  Suddenly and unexpectedly, the investment banks collapse, then General Motors becomes insolvent.  The Senate and House of Representatives cease to function properly.  Collapse is not a single event.  As we are seeing it play out now—amid the hyper-energized and dominant “industrial” economies—collapse is multiple, iterative, and repeated across scales: it is fractal.

And collapse is not monolithic or pervasive.  Indeed, some parts of the system expand and prosper.  The US is manufacturing billionaires at a record pace, the stock market continues to climb, output of everything from corn to natural gas is up, and Google and Apple are world-leading corporations.  A hallmark of collapse is that societies become dis-integrated, allowing some parts to fall as other parts rise.

The image above is a Sierpinski triangle or “gasket.”  It helps visualize this idea of fractal collapse.  Step by step, the original triangle shape develops more holes and loses area, but it does not disappear.  its outlines remain apparent.

To make a Sierpinski gasket, we start with an equilateral triangle.  Then we identify the mid-points of each side and use these as the vertices of a new triangle, which we remove from the original.  (See the top-middle triangle, above.)  This leaves us with three equilateral triangles.  We repeat this process over and over; we iterate.  From each remaining triangle we remove the middle, leaving three smaller triangles.  The Sierpinski gasket and its repeated holing can serve as a visual metaphor for the fractal collapse that may now be hollowing out many of the world’s nations.

The future is not binary, not rise or fall.  Increasingly, nations may become less homogeneous.  Some parts may expand and prosper while other parts may wither or fail.  The overall trendline may not be upward, however, but rather downward.  Our future may not be a train wreck, but rather a slow dilapidation.  Not with a bang but a wimper.  We can change this outcome.  But currently very few are trying.

The intellectual history of the idea of fractal collapse is not wholly clear.  The concept came out of the physical sciences and has been popularized as a description of social and economic collapse by author and analyst John Michael Greer.

Deep into the red: US national debt per family, 1816 to 2016

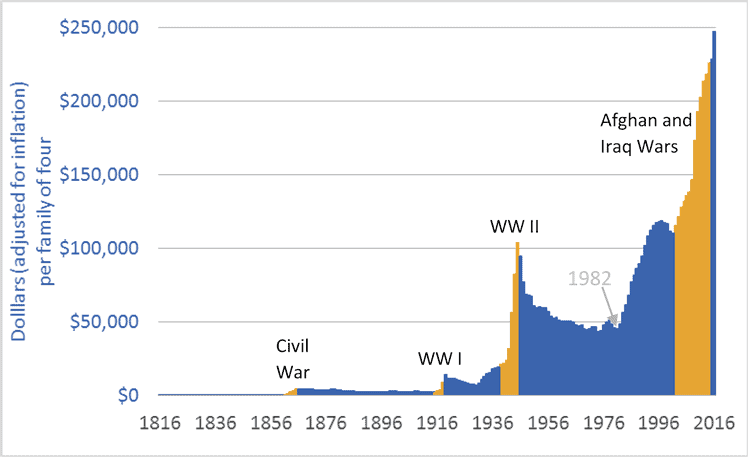
US national debt graph 1816 to 2016, dollars per family
United States national debt, per family of four, 1816-2016

In the United States, federal government debt is nearly $20 trillion. That works out to about $62,000 per person, or just under $250,000 for a hypothetical family of four. Adjusted for inflation, debt has doubled since 2002, and is five times higher than in 1982.

The graph above shows the increasing size of the US national debt. The time-frame is 1816 to 2016. The units are US dollars, adjusted for inflation. In the graph, some conflict periods are highlighted in a contrasting colour. Wars have caused rapid increases in government debt. Indeed, the wars in Iraq and Afghanistan (2002-2014) played significant roles in creating the unprecedented level of debt US families now must carry. Other factors include a financial meltdown and bailout, and tax cuts that eroded revenues and forced governments to fund a greater portion of their services with borrowed money. As visible in the graph, 1982 marks the beginning of the recent phase of debt expansion. That is also the beginning of the modern era of tax cutting—the implementation of the Reagan tax cuts. US citizens have enjoyed tax cuts, but have yet to pay for them.

The graph shows that periods of increasing national debt (the Civil War, WW I, and WW II) were followed by periods of declining debt. The question now is this: Does the US economy retain enough vigour, and do US citizens and businesses retain enough good sense and discipline, to pay down $20 trillion in federal government debt, trillions more in personal debt, and trillions more in city, county, and state debts? It is never wise to bet against America. But de-industrialization, rising income inequality, world-leading incarceration rates, uncontrolled gun crime, Detroit and similar rustbelt cities, legislative gridlock, crumbling infrastructure, and a retreat into ideology all raise serious concerns.

For comparison, Canadian national debt works out to about $80,000 (Cdn.) per hypothetical family of four. Canadians, however, must not feel in any way superior or safe, because the Canadian and US economies are so tightly tied. Rising US debt is a concern for all the world’s citizens.

Graph sources: U.S. Department of the Treasury, “TreasuryDirect: Historical Debt Outstanding–Annual” 

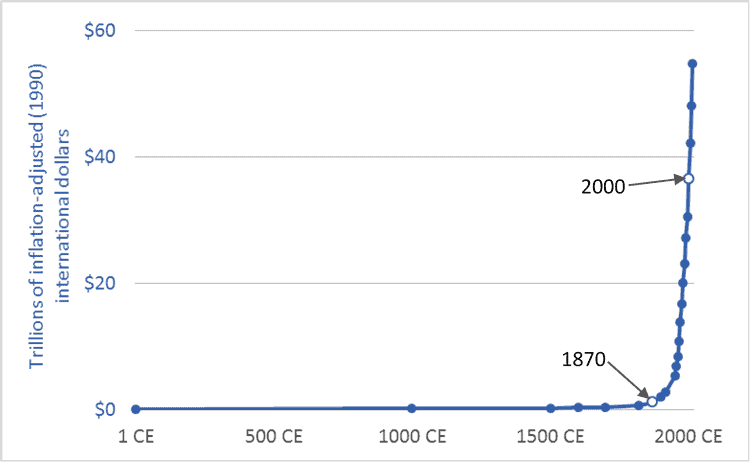
This isn’t normal: 2,000 years of economic growth

Graph of gross world product (GWP) historic, for the past two thousand years
Gross World Product (GWP) over the long term, 1 CE – 2015 CE

The graph above places our 21st century global economy in its long-term context. It plots Gross World Product (GWP), the global aggregation of Gross Domestic Product (GDP). The time frame is the past 2,015 years: 1 CE (or AD) to 2015 CE. The units are trillions of US/international dollars adjusted for inflation (converted to 1990 dollars). The main source is Angus Maddison.  Pre-20th century values are, by necessity, informed estimates by Maddison.

The year 1870 is marked with a white circle. In the millennia before 1870, the size of the global economy barely grew at all. Then, not long before the eve of the 20th century, all Hell broke loose. The most recent ten or fifteen decades appear in our historical economic record like an explosion. For perhaps 98 percent of human history, the economic trendline has been almost flat—horizontal. Over the past century-and-a-half it has been almost vertical.

The late-19th, 20th, and early 21st centuries have not been “normal.” They have been extraordinary and wondrous. Equally extraordinary is how far we have gone to normalize what is clearly an abnormal situation. Though our lifestyles and expectations are now tightly bound to near-vertical trendlines we talk and act as if nothing out of the ordinary is happening, and that we can count on more of the same for the foreseeable future.

Moreover, the 20th and 21st century exceptionalism on display in this graph is not limited to economic growth. Graphs of energy use, population, cotton or iron production, water withdrawals, food production, automobile numbers, air-travel miles, and nearly any other economic metric will look nearly identical to the graph above: millennia of little or no growth, then a sudden spike. There is upon the Earth a wholly new kind of civilization.

Graph sources: Angus Maddison, The World Economy, vol. 2, Historical Statistics (Paris: OECD, 2006) Tables 7b and 8b; and World Bank, “World DataBank: World Development Indicators: GDP at market prices”