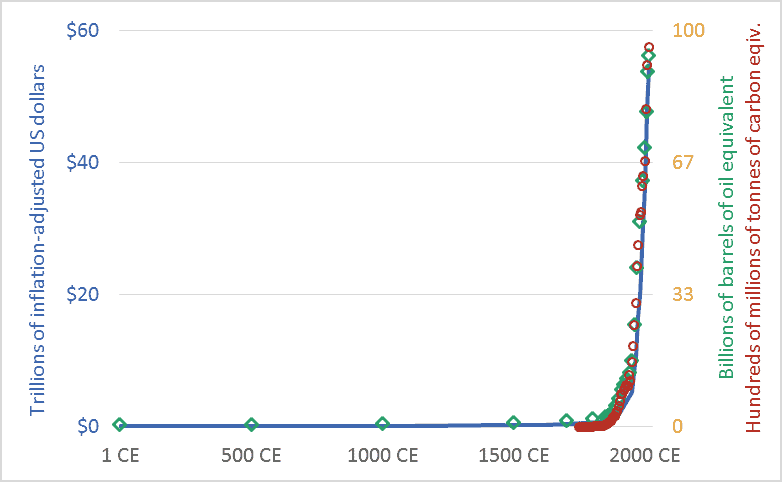
My friends sometimes suggest that I’m too pessimistic. I’m not. Rather, I’d suggest that everyone else is too optimistic. Or, more precisely, I live in a society where people are discouraged from thinking rigorously about our predicament. The graph above sets out our civilizational predicament, and it hints at the massive scale of the transformation that climate change requires us to accomplish in the coming decade or two.
The main point of the graph above is this: Long-term data shows that the size and speed of our global mega-civilization is precisely correlated with energy use, and energy use is precisely correlated with greenhouse gas emissions. We have multiplied the size of our global economy and our living standards by using more energy, and this increased energy use has led us to emit more carbon dioxide and other greenhouse gases.
The graph plots three key civilizational metrics: economic activity, energy use, and carbon dioxide (CO2) emissions. The graph covers the past 2015 years, the period from 1 CE (aka 1 AD) to 2015 CE. The blue line depicts the size of the global economy. The units are trillions of US dollars, adjusted for inflation. The green diamond-shaped markers show global energy use, with all energy converted to a common measure: barrels of oil equivalent. And the red circles show global CO2 emissions, in terms of tonnes of carbon.
Though it is seldom stated explicitly, most government and business leaders and most citizens are proceeding under the assumption that the economic growth line in the graph can continue to spike upward. This will require the energy line to also climb skyward. But our leaders are suggesting that the emissions line can be wrenched downward. When people are “optimistic” about climate change, they are optimistic about doing something that has never been done before: maintaining the upward arc of the economic and energy trendlines, but somehow unhooking the emissions trendline and bending it downward, toward zero. I worry that this will be very hard. Most important, it will be impossibly hard unless we are realistic about what we are trying to do, and about the challenges and disruptions ahead.
We must not despair, but neither should we permit ourselves unfounded optimism. There is a line from a great movie—the Cohen Brother’s “Miller’s Crossing”—in which the lead character, a gangster played by Gabriel Byrne, says “I’d worry a lot less if I thought you were worrying enough.”
Graph sources: GDP: Angus Maddison, The World Economy, Volume 1: A Millennial Perspective (Paris: Organization for Economic Co-operation and Development, 2001)
Energy consumption: Vaclav Smil, Energy in Nature and Society: General Energetics of Complex Systems (Cambridge, MA: The MIT Press, 2008); British Petroleum, BP Statistical Review of World Energy: June 2016 (London: British Petroleum, 2016); pre-1500 energy levels estimated by the author based on data in Smil.

