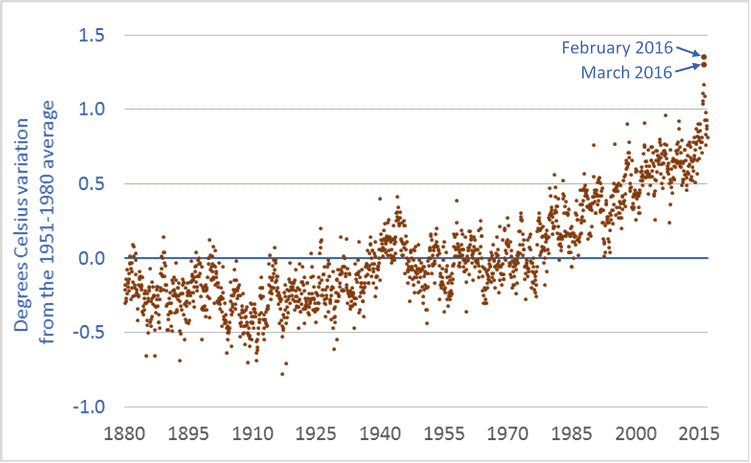
This graph shows the global temperature anomaly: how current temperatures compare to latter-twentieth-century “normal” temperatures. Normal, here, is the 1951-1980 average.
in looking at the global temperature data, three things are apparent. First, the Earth is already warming. The graph has been trending strongly upward since at least the 1980s. Second, the increase in temperature from the 1951-1980 baseline period will soon reach one degree Celsius. Indeed, temperature outliers such as those in February and March 2016 are approaching 1.5 degrees. Temperatures are rising fast—charting significant increases in decades, not centuries. Third, there is in the data-points a suggestion that the curve may be getting steeper; temperature increases may be accelerating. It’s too early to tell, but given that global temperature increases are lagging well behind atmospheric greenhouse gas (GHG) increases, and given that global emission rates continue to increase, it is prudent to consider that temperature increases may accelerate beyond already-rapid rates.
How high might temperatures go? Here’s what we know. In the lead-up to the 2015 Paris climate talks, nearly every nation submitted to the United Nations a commitment to reduce GHG emissions. The United States committed to reduce its emissions by 26 to 28 percent (below 2005 levels) by 2025. Canada committed to reduce emissions by 30 percent by 2030. Other nations made comparable commitments. But the climate models show that even if every nation meets its emission-reduction commitments, our Earth will warm this century by 3.2 degrees Celsius—well beyond the so-called “dangerous” level of 2 degrees C, and more than double the 1.5 degree mark discussed in Paris. Indeed, the graph above makes it clear that 1.5 degrees was always pure fiction. In order to avoid a temperature increase of 3.2 degrees, we must set and meet more ambitious targets.
Climate science can be complicated. But at a public policy level—at the levels of citizens and legislators and democratic governance—climate change is simple and clear. It is happening. It is happening fast. And it will devastate our cities, economies, food systems, ecosystems, and perhaps even our civilization unless we act fast. Simple.
To leave a comment, click on the graph or the title and then scroll down.
Graph sources: Combined Land-Surface Air and Sea-Surface Water Temperature Anomalies from National Aeronautics and Space Administration (NASA) Goddard Institute for Space Studies (GISS): GISS Surface Temperature Analysis (GISTEMP).

